S-1: General form of registration statement for all companies including face-amount certificate companies
Published on November 5, 2021
As filed with the Securities and Exchange Commission on November 5, 2021
Registration
No. 333-
SECURITIES AND EXCHANGE COMMISSION
Washington, D.C. 20549
FORM S-1
REGISTRATION STATEMENT
Under
The Securities Act of 1933
(Exact name of Registrant as specified in its charter)
7373 |
98-1562265 |
|||
|
(State or other jurisdiction of incorporation or organization) |
(Primary Standard Industrial Classification Code Number) |
(I.R.S. Employer Identification Number) |
50 33rd St,
Pittsburgh PA, 15201
(888)
583-9506
(Address, including zip code, and telephone number, including area code, of Registrant’s principal executive offices)
Chris Urmson
Chief Executive Officer and President
Aurora Innovation, Inc.
50 33rd St,
Pittsburgh PA, 15201
(888)
583-9506
(Name, address, including zip code, and telephone number, including area code, of agent for service)
Copies to:
|
Damien Weiss Megan J. Baier Mark G.C. Bass Wilson Sonsini Goodrich & Rosati, P.C. 1301 Avenue of the Americas New York, NY 10019 Telephone: (212) 999-5800
|
William Mouat, Esq. General Counsel Aurora Innovation, Inc. 50 33rd St, Pittsburgh PA, 15201 (888) 583-9506
|
Approximate date of commencement of proposed sale to the public:
If any of the securities being registered on this form are to be offered on a delayed or continuous basis pursuant to Rule 415 under the Securities Act of 1933, check the following box. ☒
If this form is filed to register additional securities for an offering pursuant to Rule 462(b) under the Securities Act, please check the following box and list the Securities Act registration statement number of the earlier effective registration statement for the same offering. ☐
If this form is a post-effective amendment filed pursuant to Rule 462(c) under the Securities Act, check the following box and list the Securities Act registration statement number of the earlier effective registration statement for the same offering. ☐
If this form is a post-effective amendment filed pursuant to Rule 462(d) under the Securities Act, check the following box and list the Securities Act registration statement number of the earlier effective registration statement for the same offering. ☐
Indicate by check mark whether the registrant is a large accelerated filer, an accelerated filer, a
non-accelerated
filer, smaller reporting company, or an emerging growth company. See the definitions of “large accelerated filer,” “accelerated filer,” “smaller reporting company,” and “emerging growth company” in Rule 12b-2
of the Exchange Act. Large accelerated filer |
☐ |
Accelerated filer |
☐ |
|||
☒ |
Smaller reporting company |
|||||
Emerging growth company |
||||||
If an emerging growth company, indicate by check mark if the registrant has elected not to use the extended transition period for complying with any new or revised financial accounting standards provided pursuant to Section 7(a)(2)(B) of the Securities Act. ☐
CALCULATION OF REGISTRATION FEE |
||||||||
|
|
||||||||
Title of Each Class of Securities to be Registered |
Amount to be Registered |
Proposed Maximum Offering Price Per Share |
Proposed Maximum Aggregate Offering Price |
Amount of Registration Fee |
||||
Class A Common Stock, par value $0.00001 per share (1)(2)
|
234,985,915 |
$9.94 (7)
|
$2,335,759,995.10 (7)
|
$216,524.95 |
||||
Class A Common Stock, par value $0.00001 per share (1)(3)
|
247,498,882 |
$9.94 (7)
|
$2,460,138,887.08 (7)
|
$228,054.88 |
||||
Class A Common Stock, par value $0.00001 per share (1)(4)
|
399,468,805 |
$9.94 (7)
|
$3,970,719,921.70 (7)
|
$368,085.74 |
||||
Warrants to purchase Class A Common Stock (1)(5)
|
8,900,000 |
$— |
$— |
$— (8)
|
||||
Class A Common Stock, par value $0.00001 per share (1)(5)
|
8,900,000 |
$9.94 (7)
|
$88,466,000.00 |
$8,200.80 |
||||
Class A Common Stock, par value $0.00001 per share (1)(6)
|
12,218,750 |
$9.94 (7)
|
$121,454,375.00 (7)
|
$11,258.82 |
||||
Total |
$816,794.93 (9)
|
|||||||
(1) |
Pursuant to Rule 416(a) under the Securities Act, this Registration Statement shall also cover an indeterminable number of additional securities as may be issued to prevent dilution resulting from stock splits, stock dividends or similar transactions. |
(2) |
Consists of (A) 234,560,193 shares of Class A Common Stock issuable by us upon conversion of Class B Common Stock held by certain of our stockholders (the “Non-Affiliate Conversion Stock”) and (B) an aggregate of 425,722 shares of the Registrant’s Class A Common Stock issuable upon the exercise of certain outstanding options to purchase Class A Common Stock held by individuals who terminated their employment with Aurora Innovation, Inc. prior to the closing of business combination among Reinvent Technology Partners Y, Aurora Innovation, Inc. and RTPY Merger Sub Inc. (the “Former Employee Options”), which are registered for issuance on this Registration Statement |
(3) |
Consists of (A) 246,547,784 shares of Class A Common Stock issuable by us upon conversion of Class B Common Stock held by certain of our stockholders (the “Affiliate Conversion Stock”) and (B) 951,098 shares of Class A Common Stock issuable upon the exercise of certain outstanding options to purchase Class A Common Stock (the “Affiliate Options”) and vesting of certain restricted stock units for Class A Common Stock held by certain of our affiliates and their affiliated entities (the “Affiliate RSUs” and together with the Affiliate Options, the “Affiliate Equity Stock”), which are registered for issuance and resale on this Registration Statement. |
(4) |
Consists of an aggregate of 399,468,805 shares of the Registrant’s Class A Common Stock registered for resale on this Registration Statement, including (A) 4,029,344 shares of Class A Common Stock beneficially owned by certain of our affiliates (the “Affiliate Class A Stock”), (B) 6,883,086 shares of Class A Common Stock beneficially owned by Reinvent Sponsor Y LLC (the “Sponsor Stock”), (C) 100,000,000 shares of Class A Common Stock purchased at Closing by a number of subscribers pursuant to separate PIPE Subscription Agreements (the “PIPE Shares”), and (D) 288,556,375 shares of Class A Common Stock beneficially owned by certain stockholders who have been granted registration rights (the “Registration Rights Shares”). These shares are registered for resale on this Registration Statement. |
(5) |
Refers to (A) 8,900,000 warrants that were purchased by the Sponsor in connection with the RTPY IPO in a private placement (the “ Private Placement Warrants”) registered for resale on this Registration Statement and (B) 8,900,000 shares of the Registrant’s Class A Common Stock issuable upon exercise of the Private Placement Warrants registered for issuance and resale on this Registration Statement. Each Private Placement Warrant is exercisable for one share of the Registrant’s Class A Common Stock at a price of $11.50 per share, subject to adjustment. |
(6) |
Consists of 12,218,750 shares of the Registrant’s Class A Common Stock issuable upon exercise of public warrants that were issued to stockholders in connection with the RTPY IPO Private Placement Warrants, which are registered for issuance on this Registration Statement. Each Public Warrant is exercisable for one share of the Registrant’s Class A Common Stock at a price of $11.50 per share, subject to adjustment. |
(7) |
Estimated solely for purposes of calculating the registration fee according to Rule 457(c) under the Securities Act based on the average of the high and low prices of the Registrant’s Class A Common Stock quoted on the Nasdaq Capital Market on November 2, 2021. |
(8) |
Pursuant to Rule 457(g) of the Securities Act, no separate fee is recorded for the Warrants and the entire fee is allocated to the underlying Class A Common Stock. |
(9) |
Pursuant to Rule 457(p) under the Securities Act, the Registrant is offsetting the registration fee due under this Registration Statement by $15,330.26, which represents the portion of the registration fee paid with respect to securities that had previously been included in the Registrant’s registration statement on Form S-1, as amended (Registration Statement No. 333-253075), which was originally filed with the Securities and Exchange Commission on February 12, 2021 and was declared effective by the Securities and Exchange Commission on March 15, 2021. |
The Registrant hereby amends this Registration Statement on such date or dates as may be necessary to delay its effective date until the Registrant shall file a further amendment which specifically states that this Registration Statement shall thereafter become effective in accordance with Section 8(a) of the Securities Act of 1933 or until the Registration Statement shall become effective on such date as the Commission acting pursuant to said Section 8(a) may determine.
EXPLANATORY NOTE
On November 3, 2021 (the “Closing”), Aurora Innovation, Inc. (the “Company” or “Aurora”), f/k/a Reinvent Technology Partners Y, our legal predecessor and a special purpose acquisition company (“RTPY”) sponsored by affiliates of Reinvent Sponsor Y LLC, consummated the previously announced Merger with Aurora Innovation, Inc. (“Legacy Aurora”), and RTPY Merger Sub Inc. (“Merger Sub”), a wholly owned subsidiary of RTPY pursuant to a Business Combination Agreement dated July 14, 2021. Pursuant to the Merger, Merger Sub merged with and into Legacy Aurora, the separate corporate existence of Merger Sub ceased, and Legacy Aurora continued as the surviving corporation in the Merger and as a wholly owned subsidiary of RTPY. RTPY simultaneously changed its name from Reinvent Technology Partners Y to Aurora Innovation, Inc. The Merger was approved by RTPY’s stockholders at a meeting held on November 2, 2021.
As of the open of trading on November 4, 2021, the Company’s Class A Common Stock (the “Class A Common Stock”) and warrants (the “Warrants”), formerly those of RTPY, began trading on The Nasdaq Global Select Market (“Nasdaq”) under the symbols “AUR” and “AUROW”, respectively.
At the Closing and subject to the conditions of the Business Combination Agreement, all shares of capital stock of Legacy Aurora were cancelled and converted into the right to receive a number of shares of the Company’s Class A Common Stock equal to approximately 2.1708 (the “Exchange Ratio”) and shares of the Company’s Class B Common Stock equal to the Exchange Ratio, and each option to purchase shares of Legacy Aurora common stock or restricted stock units of Legacy Aurora, whether vested or unvested, was converted into an option to purchase shares of the Company’s Class A Common Stock or a restricted stock unit of the Company, as applicable, with the same terms except for the number of shares exercisable and the exercise price, using the Exchange Ratio.
Also at the Closing, a number of accredited investor purchasers (each a “PIPE Investor”) purchased from the Company an aggregate of 100,000,000 shares of Class A Common Stock, for a purchase price of $10.00 per share for an aggregate purchase price of $1.0 billion (the “PIPE Shares”), each pursuant to a separate subscription agreement (each, a “PIPE Subscription Agreement”), entered into effective as of July 14, 2021. Pursuant to the PIPE Subscription Agreements, the Company gave certain registration rights to the PIPE Investors with respect to the PIPE Shares, which shares are registered here.
Additional equity securities are registered here in accordance with the terms and conditions of the registration rights agreement entered into at the Closing by and among the Company, Sponsor, certain affiliates of the Sponsor and certain Legacy Aurora stockholders.
The information in this preliminary prospectus is not complete and may be changed. These securities may not be sold until the registration statement filed with the Securities and Exchange Commission is effective. This prospectus is not an offer to sell these securities, nor does it seek an offer to buy these securities in any jurisdiction where the offer or sale is not permitted.
PRELIMINARY PROSPECTUS |
Subject to Completion |
November 5, 2021 |
903,072,352 Shares of Class A Common Stock
8,900,000 Warrants to Purchase Shares of Class A Common Stock

This prospectus relates to the registration of the Class A Common Stock, par value $0.00001 per share, of Aurora Innovation, Inc. and warrants to purchase shares of Class A Common Stock as described herein.
This prospectus also relates to the issuance and sale by us of an aggregate of (i) 234,560,193 shares of Class A Common Stock issuable by us upon conversion of the Class B Common Stock, par value $0.00001 per share, of Aurora Innovation, Inc. (the “Class B Common Stock”), held by certain of our stockholders, par value $0.00001 per share, of Aurora Innovation, Inc. (the
“Non-Affiliate
Conversion Stock”), (ii) 425,722 shares of Class A Common Stock issuable upon the exercise of certain outstanding options to purchase Class A Common Stock held by individuals who terminated their employment with Aurora Innovation, Inc. prior to the closing of business combination among Reinvent Technology Partners Y, Aurora Innovation, Inc. and RTPY Merger Sub Inc. (the “Former Employee Options”) and (iii) 12,218,750 shares of Class A Common Stock issuable upon the exercise of 12,218,750 warrants, exercisable on December 3, 2021, at a price of $11.50 per share (the “Public Warrants”). This prospectus also relates to the issuance and resale of (i) 246,547,784 shares of Class A Common Stock issuable by us upon conversion of the Class B Common Stock held by certain of our stockholders the (“Affiliate Conversion Stock”), (ii) 951,098 shares of Class A Common Stock issuable upon the exercise of certain outstanding options to purchase Class A Common Stock (the “Affiliate Options”) and vesting of certain restricted stock units for Class A Common Stock held by certain of our affiliates and their affiliated entities (the “Affiliate RSUs” and together with the Affiliate Options, the “Affiliate Equity Stock”) and (iii) 8,900,000 shares of Class A Common Stock issuable upon the exercise of 8,900,000 Private Placement Warrants.
This prospectus also relates to the resale from time to time by the selling securityholders named in this prospectus or their permitted transferees (the “Selling Securityholders”) of (i) 4,029,344 shares of Class A Common Stock beneficially owned by certain of our affiliates (the “Affiliate Class A Stock”), (ii) 6,883,086 shares of Class A Common Stock beneficially owned by Reinvent Sponsor Y LLC (the “Sponsor Stock”), (iii) 100,000,000 shares of Class A Common Stock purchased at Closing by a number of subscribers pursuant to separate PIPE Subscription Agreements (the “PIPE Shares”), (iv) 288,556,375 shares of Class A Common Stock beneficially owned by certain stockholders who have been granted registration rights (the “Registration Rights Shares”) and (v) 8,900,000 Private Placement Warrants purchased by the Sponsor in connection with the RTPY IPO.
The Selling Securityholders may sell any, all or none of the securities and we do not know when or in what amount the Selling Securityholders may sell their securities hereunder following the date of this prospectus. The Selling Securityholders may sell the securities described in this prospectus in a number of different ways and at varying prices. We provide more information about how the Selling Securityholders may sell their securities in the section titled “” appearing elsewhere in this prospectus.
Plan of Distribution
We will not receive any of the proceeds from the sale of the securities by the Selling Securityholders. We will receive proceeds from the exercise of the Warrants if the Warrants are exercised for cash and from the exercise of the Affiliate Options and the Former Employee Options. We will pay the expenses associated with registering the sales by the Selling Securityholders other than any underwriting discounts and commissions, as described in more detail in the section titled “” appearing elsewhere in this prospectus.
Use of Proceeds
Of the 903,072,352 shares of Class A Common Stock that may be offered or sold by Selling Securityholders identified in this prospectus, 802,952,352 of those shares (the
“Lock-Up
Shares”) are subject to certain lock-up
restrictions, pursuant to our bylaws and/or other agreements further described in the section titled “Certain Relationships and Related Person Transactions” appearing elsewhere in this prospectus. Our Class A Common Stock is listed on The Nasdaq Global Select Market (“Nasdaq”) under the symbol “AUR” and the Public Warrants are listed on Nasdaq under the symbol “AUROW”. On November 2, 2021, the last quoted sale price for our Class A Common Stock as reported on Nasdaq was $9.94 per share and the last quoted sale price for our Public Warrants as reported on Nasdaq was $2.40 per warrant.
We are an “emerging growth company,” as defined under the federal securities laws, and, as such, may elect to comply with certain reduced public company reporting requirements for this prospectus and for future filings.
Investing in our securities involves a high degree of risk. Before buying any securities, you should carefully read the discussion of the risks of investing in our securities in “Risk Factors” beginning on page 7 of this prospectus.
You should rely only on the information contained in this prospectus or any prospectus supplement or amendment hereto. We have not authorized anyone to provide you with different information.
Neither the Securities and Exchange Commission nor any state securities commission has approved or disapproved of these securities or determined if this prospectus is truthful or complete. Any representation to the contrary is a criminal offense.
Prospectus dated , 2021
TABLE OF CONTENTS
Page |
||||
| iii | ||||
| viii | ||||
| 1 | ||||
| 7 | ||||
| 38 | ||||
| 39 | ||||
| 40 | ||||
| 58 | ||||
| 71 | ||||
| 91 | ||||
| 98 | ||||
| 105 | ||||
| 120 | ||||
| 125 | ||||
| 140 | ||||
| 141 | ||||
| 145 | ||||
| 149 | ||||
| 149 | ||||
| 150 | ||||
F-1 |
||||
You should rely only on the information contained in this prospectus or in any applicable prospectus supplement prepared by us or on our behalf. Neither we nor the Selling Securityholders have authorized any other person to provide you with different information. If anyone provides you with different or inconsistent information, you should not rely on it. Neither we nor the Selling Securityholders are making an offer to sell these securities in any jurisdiction where the offer or sale is not permitted. You should assume that the information appearing in this prospectus is accurate only as of the date on the front cover of this prospectus. Our business, financial condition, results of operations and prospects may have changed since that date.
This prospectus is part of a registration statement on
Form S-1
that we filed with the Securities and Exchange Commission (the “SEC”) using the “shelf” registration process. Under this shelf registration process, the selling securityholders hereunder may, from time to time, sell the securities offered by them described in this prospectus. We will not receive any proceeds from the sale by such selling securityholders of the securities offered by them described in this prospectus. We may also provide a prospectus supplement or post-effective amendment to the registration statement to add information to, or update or change information contained in, this prospectus. You should read both this prospectus and any applicable prospectus supplement or post-effective amendment to the registration statement together with the additional information to which we refer you in the section of this prospectus titled “.”
Where You Can Find Additional Information
The Aurora design logo and the Aurora mark appearing in this prospectus are the property of Aurora Innovation, Inc. Trade names, trademarks and service marks of other companies appearing in this prospectus are the property of their respective holders. We have omitted the
®
and TM designations, as applicable, for the trademarks used in this prospectus. -i-
Within this prospectus, we reference industry and market data obtained from periodic industry publications, third-party studies and surveys, including from the American Automobile Association, American Transportation Research Institute, American Trucking Association, Armstrong & Associates, National Highway Traffic Safety Administration, RAND Corporation, Pitney Bowes, Department of Transportation, Department of Commerce, Bureau of Labor Statistics, Federal Highway Administration and the World Health Organization, as well as from filings of public companies in our industry and internal company surveys. These sources include government and industry sources. Industry publications and surveys generally state that the information contained therein has been obtained from sources believed to be reliable. Although we believe the industry and market data to be reliable as of the date of this prospectus, this information could prove to be inaccurate. Industry and market data could be wrong because of the method by which sources obtained their data and because information cannot always be verified with complete certainty due to the limits on the availability and reliability of raw data, the voluntary nature of the data gathering process and other limitations and uncertainties. Each publication, study and report is as of its original publication date (and not as of the date of this prospectus). Certain of these publications, studies and reports were published before
the COVID-19 pandemic
and therefore do not reflect any impact of COVID-19 on
any specific market or globally. In addition, we do not know all of the assumptions regarding general economic conditions or growth that were used in preparing the forecasts from the sources relied upon or cited herein. Neither we nor our stockholders can guarantee the accuracy or completeness of any such information contained in this prospectus. -ii-
FREQUENTLY USED TERMS
Unless otherwise stated or unless the context otherwise requires, references in this prospectus to (1) “Legacy Aurora” refers to Aurora Innovation, Inc., a Delaware corporation, prior to the Merger, (2) “RTPY” refers to Reinvent Technology Partners Y, a Cayman company and our legal predecessor, prior to the Merger, and (3) “Aurora,” the “Company,” “Registrant,” “we,” “us” and “our” refers to Aurora Innovation, Inc., a Delaware corporation formerly known as Reinvent Technology Partners Y, and where appropriate, our wholly owned subsidiaries, following the Merger.
In this document:
“2017 Plan” are to the Aurora 2017 Equity Incentive Plan.
“2021 Plan” are to the Aurora Innovation, Inc. 2021 Equity Incentive Plan.
“Aggregate Merger Consideration” are to the number of shares of Aurora common stock equal to the quotient obtained by dividing (i) $11.0 billion, representing
the pre-transaction equity
value of Aurora, by (ii) $10.00. “Apparate” are to Apparate USA LLC, formerly a subsidiary of Uber Technologies Inc., which was acquired by Aurora on January 19, 2021.
“Aurora Founders” are to Chris Urmson, Sterling Anderson and James Andrew (Drew) Bagnell.
“Aurora Incentive Plans” are to the Legacy Aurora 2017 Equity Incentive Plan, the Blackmore Sensors & Analytics, Inc. 2016 Equity Incentive Plan, and the OURS Technology Inc. 2017 Stock Incentive Plan, in each case, as amended.
“Aurora common stock” are to shares of Class A Common Stock and Class B Common Stock.
“Aurora Options” are to options to purchase shares of Class A Common Stock.
“Aurora RSU Awards” are to awards of restricted stock units based on shares of Class A Common Stock.
“Aurora” are to RTPY after the Business Combination and its name change from Reinvent Technology Partners Y to Aurora Innovation, Inc.
“Aurora PIPE Investor” are to a PIPE Investor that is a holder of shares of Legacy Aurora capital stock or securities exercisable for or convertible into Legacy Aurora capital stock as of the date of the Merger Agreement and not a Sponsor Related PIPE Investor.
“Legacy Aurora preferred stock” are to the Series Seed 1 preferred stock, Series Seed 2 preferred stock, Series A preferred stock, Series B preferred stock,
Series B-1 preferred
stock, Series U-1 preferred
stock and Series U-2 preferred
stock of Legacy Aurora. “Legacy Aurora restricted stock” are to shares of Legacy Aurora common stock, which are subject to a substantial risk of forfeiture (within the meaning of Section 83 of the Code).
“Legacy Aurora RSU Awards” are to awards of restricted stock units based on shares of Legacy Aurora common stock granted under the Aurora Incentive Plans.
“Legacy Aurora Stockholders” are to the stockholders of Legacy Aurora and holders of Legacy Aurora Awards prior to the Business Combination.
-iii-
“Available Cash” are to the amount as calculated by adding the Trust Amount and the PIPE Investment Amount.
“Blackmore” are to Blackmore Sensors & Analytics, Inc.
“Board” means the board of directors of Aurora.
“Business Combination” are to the Domestication together with the Merger.
“Business Combination Agreement” means the Agreement and Plan of Merger, dated as of July 14, 2021, by and among RTPY, Merger Sub and Legacy Aurora.
“Bylaws” are to the bylaws of Aurora.
“Cayman Constitutional Documents” are to RTPY’s Amended and Restated Memorandum of Association (the “Existing Memorandum”) and RTPY’s Amended and Restated Articles of Association (the “Existing Articles”), each as amended from time to time.
“Certificate of Incorporation” are to the certificate of incorporation of Aurora.
“Class A Common Stock” means the shares of Class A Common Stock of Aurora Innovation, Inc., par value $0.00001 per share.
“Class B Common Stock” means the shares of Class B Common Stock of Aurora Innovation, Inc., par value $0.00001 per share.
“Closing” means the consummation of the Merger, which occurred on November 3, 2021.
“Code” means the Internal Revenue Code of 1986, as amended.
“Company,” “we,” “us” and “our” are to Aurora.
“Continental” are to Continental Stock Transfer & Trust Company.
“DENSO” are to DENSO International America, Inc.
“DGCL” means the Delaware General Corporation Law.
“Domestication” are to the domestication of RTPY as a corporation incorporated in the State of Delaware.
“Exchange Act” means the Securities Exchange Act of 1934, as amended.
“Exchange Ratio” are to the quotient obtained by dividing (a) the Aggregate Merger Consideration by (b) the aggregate fully diluted number of shares of Legacy Aurora common stock issued and outstanding immediately prior to the Merger (which is (i) the aggregate number of shares of Legacy Aurora common stock (A) issued and outstanding immediately prior to the Merger, (B) issuable upon the conversion of the Legacy Aurora preferred stock immediately prior to the Merger in accordance with Aurora’s Organizational Documents, (C) issuable upon, or subject to, the exercise of Legacy Aurora Options (whether or not then vested or exercisable) that are outstanding immediately prior to the Merger, and (D) subject to Legacy Aurora RSU Awards (whether or not then vested) that are outstanding immediately prior to the Merger, (ii) a number of shares of Legacy Aurora common stock equal to (x) the aggregate exercise price of the Legacy Aurora Options described in clause (C) above (y) the Per Share Merger Consideration).
minus
divided by
-iv-
“GAAP” means United States generally accepted accounting principles.
“Investor Rights Agreement” means the Investor Rights Agreement, entered into at the Closing, by and among RTPY, Legacy Aurora, and certain persons and entities holding Class A Common Stock.
“IRS” are to the U.S. Internal Revenue Service.
“JOBS Act” means the Jumpstart Our Business Startups Act of 2012, as amended.
“Legacy Aurora” means Aurora Innovation, Inc., prior to the Business Combination.
“Legacy Aurora Awards” are to Legacy Aurora Options and Legacy Aurora RSU Awards.
“Legacy Aurora Class B stock” are to shares of Legacy Aurora Class B stock, par value $0.0001 per share.
“Legacy Aurora capital stock” are to shares of Legacy Aurora common stock and Legacy Aurora Class B stock.
“Legacy Aurora common stock” are to shares of Legacy Aurora common stock, par value $0.0001 per share.
“Legacy Aurora Options” are to options to purchase shares of Legacy Aurora common stock granted under the Aurora Incentive Plans
“Merger” refers to the merging of Merger Sub with and into Legacy Aurora, with Legacy Aurora surviving the Merger as a wholly owned subsidiary of the Company and the other transactions contemplated by the Business Combination Agreement, consummated as of the Closing.
“Merger Agreement” are to the Agreement and Plan of Merger, dated as of July 14, 2021, by and among RTPY, Merger Sub and Aurora, as amended and modified from time to time.
“Merger Sub” means RTPY Merger Sub, Inc., a Delaware corporation.
“Morgan Stanley” are to Morgan Stanley & Co LLC.
“Nasdaq” means The Nasdaq Global Select Market.
“Organizational Documents” are to the Certificate of Incorporation and the Bylaws.
“PACCAR” are to PACCAR Inc.
“Per Share Merger Consideration” means the product obtained by multiplying (i) the Exchange Ratio by (ii) $10.00.
“Person” are to any individual, firm, corporation, partnership, limited liability company, incorporated or unincorporated association, joint venture, joint stock company, governmental authority or instrumentality or other entity of any kind.
“PIPE Investment” means the purchase of 100,000,000 shares of Class A Common Stock by certain accredited investors pursuant to the PIPE Subscription Agreement in connection with the Closing, for a purchase price of $10.00 per share, in a private placement.
-v-
“PIPE Investment Amount” are to the aggregate gross purchase price actually received by RTPY prior to or substantially concurrently with Closing for the shares in the PIPE Investment of $1,000,000,000.
“PIPE Shares” are to the shares of Class A Common Stock to be issued to PIPE Investors in connection with the PIPE Investment.
“PIPE Subscription Agreement” means that certain Subscription Agreement between the Company and the PIPE Investors pursuant to which the PIPE Investors agreed to purchase, in the aggregate, 100,000,000 shares of Class A Common Stock at $10.00 per share for an aggregate commitment amount of $1,000,000,000.
“Pre-Closing Restructuring”
are to the Conversion Amendment, Preferred Stock Conversion, and the Exchange, in each case as set forth in the Merger Agreement. “Preferred Stock” means the shares of preferred stock of Aurora, par value $0.00001 per share.
“Private Placement Warrants” means the warrants to purchase shares of Class A Common Stock purchased in a private placement in connection with the RTPY IPO, exercisable for one share of Class A Common Stock at a price of $11.50 per share, subject to adjustments.
“pro forma” are to giving pro forma effect to the Business Combination.
“Public Warrants” means the warrants to purchase shares of Class A Common Stock that are publicly traded under the “AURW” symbol on Nasdaq, exercisable for one share of Class A Common Stock at a price of $11.50 per share, subject to adjustments.
“redemption” are to each redemption of public shares for cash pursuant to the Cayman Constitutional Documents and the Proposed Organizational Documents.
“Registration Statement” are to the registration statement of which this prospectus forms a part.
“Reinvent Capital” are to Reinvent Capital LLC.
“RTPY Board” are to the board of directors of RTPY.
“RTPY Class A ordinary shares” are to RTPY’s Class A ordinary shares, par value $0.00001 per share.
“RTPY Class B ordinary shares” are to RTPY’s Class B ordinary shares, par value $0.00001 per share.
“RTPY Founder Shares” are to the RTPY Class B ordinary shares purchased by the Sponsor in a private placement prior to the RTPY IPO.
“RTPY IPO” means RTPY’s initial public offering of Units, consummated on March 18, 2020.
“RTPY IPO registration statement” are to the Registration Statement on filed by RTPY in connection with its initial public offering, which became effective on March 18, 2021.
Form S-1 (333-253075)
“RTPY ordinary shares” are to RTPY Class A ordinary shares and RTPY Class B ordinary shares.
“RTPY units” and “units” are to the units of RTPY, each unit representing one RTPY Class A ordinary share
and one-eighth of
one redeemable warrant to acquire one RTPY Class A ordinary share, that were offered and sold by RTPY in the RTPY IPO and registered pursuant to the RTPY IPO registration statement (less the number of units that have been separated into the underlying public shares and underlying warrants upon the request of the holder thereof). -vi-
“RTPY” refers to the former Reinvent Technology Partners Y, now known as Aurora Innovation, Inc., a Delaware corporation.
“Sarbanes-Oxley Act” are to the Sarbanes-Oxley Act of 2002.
“SEC” means the U.S. Securities and Exchange Commission.
“Securities Act” means the Securities Act of 1933, as amended.
“Sponsor” means Reinvent Sponsor Y LLC, a Cayman Islands limited liability company.
“Sponsor Agreement” are to that certain Sponsor Agreement, dated as of July 14, 2021, by and among the Sponsor, RTPY and Aurora, as amended and modified from time to time.
“Sponsor Related PIPE Investor” are to Reinvent Technology SPV II LLC, which is a special purpose vehicle formed solely to invest in the PIPE Investment.
“Sponsor Shares” are to the shares of Class A Common Stock received by the Sponsor upon the conversion of RTPY Class B Ordinary Shares held by the Sponsor in the Domestication.
“Sponsor Support Agreement” are to that certain Sponsor Support Agreement, dated as of July 14, 2021, by and among the Sponsor, RTPY, the directors and officers of RTPY, and Aurora.
“Stockholder
Lock-Up
Agreement” means that Stockholder Lock-Up
Agreement entered into at Closing by and among Aurora, the Sponsor, certain affiliates of the Sponsor, and certain Legacy Aurora stockholders. “Subscription Agreements” means the PIPE Subscription Agreements and the Sponsor Backstop Subscription Agreement.
“Third Party PIPE Investors” are to those certain third-party investors who participated in the PIPE Investment.
“Treasury Regulations” are to the regulations promulgated under the Code by the United States Department of the Treasury (whether in final, proposed or temporary form), as the same may be amended from time to time.
“trust account” are to the trust account established at the consummation of the RTPY IPO at Morgan Stanley and maintained by Continental, acting as trustee.
“Trust Amount” are to the amount of cash available in the trust account as of the Closing, after deducting the amount required to satisfy RTPY’s obligations to its shareholders (if any) that exercise their redemption rights and after payment of any (x) deferred underwriting commissions being held in the trust account and (y) Aurora transaction expenses or RTPY transaction expenses.
“Uber” are to Uber Technologies, Inc.
“Volvo” are to Volvo Group.
“Warrant Agreement” are to the Warrant Agreement, dated as of March 15, 2021, by and between RTPY and Continental, as warrant agent.
“Warrants” means the Public Warrants and Private Placement Warrants.
-vii-
CAUTIONARY NOTE REGARDING FORWARD-LOOKING STATEMENTS
This prospectus contains forward-looking statements within the meaning of the federal securities laws, which statements involve substantial risks and uncertainties. Forward-looking statements generally relate to future events or our future financial or operating performance. In some cases, you can identify forward-looking statements because they contain words such as “may,” “might,” “possible,” “will,” “should,” “expect,” “plan,” “anticipate,” “could,” “intend,” “target,” “project,” “contemplate,” “believe,” “estimate,” “predict,” “potential” or “continue” or the negative of these words or other similar terms or expressions that concern our expectations, strategy, plans or intentions. Forward-looking statements contained in this prospectus include statements about:
| • | the Company’s ability to recognize anticipated benefits of the Merger, which may be affected by, among other things, the ability of the Company to grow and manage growth profitably following the Closing; |
| • | the projected financial information, including but not limited to assumptions around vehicle miles traveled, market penetration and pricing; |
| • | our estimated total addressable market, the market for autonomous vehicles, and our market position; |
| • | the ability to maintain the listing of our Class A Common Stock and warrants on Nasdaq; |
| • | our ability to raise financing in the future; |
| • | our ability to effectively manage our growth and future expenses; |
| • | the sufficiency of our cash and cash equivalents to meet our operating requirements; |
| • | our success in retaining or recruiting, or changes required in, our officers, key employees or directors; |
| • | the impact of the regulatory environment and complexities with compliance related to such environment; |
| • | our ability to successfully collaborate with business partners; |
| • | our ability to obtain, maintain, protect and enforce our intellectual property; |
| • | the impact of the COVID-19 pandemic; and |
| • | other factors detailed under the section entitled “ Risk Factors |
We caution you that the foregoing list does not contain all of the forward-looking statements made in this prospectus.
You should not rely upon forward-looking statements as predictions of future events. We have based the forward-looking statements contained in this prospectus primarily on our current expectations and projections about future events and trends that we believe may affect our business, operating results, financial condition and prospects. The outcome of the events described in these forward-looking statements is subject to risks, uncertainties and other factors, including those described in the section titled “” and elsewhere in this prospectus. Moreover, we operate in a very competitive and rapidly changing environment. New risks and uncertainties emerge from time to time and it is not possible for us to predict all risks and uncertainties that could have an impact on the forward-looking statements contained in this prospectus. We cannot assure you that the results, events and circumstances reflected in the forward-looking statements will be achieved or occur, and actual results, events or circumstances could differ materially from those described in the forward-looking statements.
Risk Factors
Neither we nor any other person assumes responsibility for the accuracy and completeness of any of these forward-looking statements. Moreover, the forward-looking statements made in this prospectus relate only to events as of the date on which the statements are made. We undertake no obligation to update any forward-looking statements made in this prospectus to reflect events or circumstances after the date of this prospectus or to reflect new information or the occurrence of unanticipated events, except as required by law. You should not place undue reliance on our forward-looking statements. Our forward-looking statements do not reflect the potential impact of any future acquisitions, mergers, dispositions, joint ventures or investments we may make.
-viii-
PROSPECTUS SUMMARY
The following summary highlights information contained elsewhere in this prospectus. It does not contain all the information you should consider before investing in our Class A Common Stock or Warrants. You should read this entire prospectus carefully, including the sections titled “Risk Factors,” “Business,” “Management’s Discussion and Analysis of Financial Condition and Results of Operations,” “Where You Can Find Additional Information,” “Unaudited Pro Forma Condensed Combined Financial Information,” and our consolidated financial statements and related notes included elsewhere in this prospectus, before making an investment decision. In this prospectus, unless the context requires otherwise, all references to “we,” “our,” “us,” “Aurora,” the “Registrant,” and the “Company” refer to Aurora Innovation, Inc. and its consolidated subsidiaries following the Business Combination.
Overview
Aurora’s mission is to deliver the benefits of self-driving technology safely, quickly, and broadly.
Aurora was founded in 2017 by Chris Urmson, Sterling Anderson, and Drew Bagnell, three of the most prominent leaders in the self-driving space. Led by a team with deep experience, Aurora is developing the Aurora Driver based on what it believes to be the most advanced and scalable suite of self-driving hardware, software, and data services in the world to fundamentally transform the global transportation market. The Aurora Driver is designed as a platform to adapt and interoperate amongst a multitude of vehicle types and applications. As of September 30, 2021, it has been successfully integrated into eight different vehicle platforms: from passenger vehicles to light commercial vehicles to Class 8 trucks. By creating a common driver platform Aurora Driver for multiple vehicle types and use cases, the capabilities Aurora develops in one market reinforce and strengthen its competitive advantages in other areas. For example, the capabilities needed for a truck to move safely at highway speeds would also be critical in ride hailing, when driving a passenger to the airport via a highway. Aurora believes this is the right approach to bring self-driving to market and will enable it to capitalize on a massive opportunity, including what we believe to be a $4 trillion global trucking market, a $5 trillion passenger mobility market, and a $400 billion local goods delivery market.
We file annual, quarterly and current reports, proxy statements and other information with the SEC. The SEC maintains an Internet website at that contains reports, proxy and information statements and other information about issuers, like us, that file electronically with the SEC. We also maintain a website at . We make available, free of charge, on our investor relations website at
www.sec.gov
www.aurora.tech
https://aurora.tech/ir
, our Annual Reports on Form 10-K,
Quarterly Reports on Form 10-Q,
Current Reports on Form 8-K
and amendments to these reports as soon as reasonably practicable after electronically filing or furnishing those reports to the SEC. Information contained on our website is not a part of or incorporated by reference into this prospectus and the inclusion of our website and investor relations website addresses in this prospectus is an inactive textual reference only. Background
On November 3, 2021, RTPY, our legal predecessor company and a special purpose acquisition company
co-founded
by Reid Hoffman, Mark Pincus and Michael Thompson that closed its initial public offering in March 2021, consummated the previously announced merger with Aurora Innovation, Inc. and RTPY Merger Sub, Inc., a Delaware corporation and a wholly owned subsidiary of RTPY. Pursuant to the Merger, Merger Sub merged with and into Aurora Innovation, Inc. the separate corporate existence of Merger Sub ceased, and Aurora Innovation, Inc. continued as the surviving corporation in the Merger and as a wholly owned subsidiary of RTPY. The Merger was approved by RTPY’s stockholders at a meeting held on November 2, 2021. On the Closing, RTPY changed its name to Aurora Innovation, Inc. -1-
On November 4, 2021, our common stock and warrants, formerly those of RTPY, began trading on The Nasdaq Global Select Market under the ticker symbols “AUR” and “AUROW,” respectively.
As a result of the Merger, we raised gross proceeds of $1.2 billion, including the contribution of $0.2 billion of cash held in RTPY’s trust account from the RTPY IPO, net of the redemption of RTPY common stock held by RTPY’s public stockholders of $0.8 billion and $1 billion private investment in public equity at $10.00 per share of our Class A Common Stock. As a result of the Merger, we received net proceeds of $1.1 billion, net of estimated transaction costs of $0.1 billion. See “” elsewhere in this prospectus for more information.
Unaudited Pro Forma Condensed Combined Financial Information
Risk Factors Summary
Our business is subject to numerous risks and uncertainties, including those highlighted in the section titled “” immediately following this prospectus summary. The following is a summary of the principal risks we face:
Risk Factors
| • | Self-driving technology is an emerging technology, and we face significant technical challenges to commercialize our technology, and if we cannot successfully overcome those challenges or do so on a timely basis, our ability to grow our business will be negatively impacted. |
| • | We are an early stage company with a history of losses, and we expect to incur significant expenses and continuing losses for the foreseeable future. |
| • | Aurora’s limited operating history makes it difficult to evaluate our future prospects and the risks and challenges we may encounter. |
| • | Aurora operates in a highly competitive market and some market participants have substantially greater resources. If one or more of our competitors commercialize their self-driving technology before we do, develop superior technology, or are perceived to have better technology, it could materially and adversely affect our business, prospects, financial condition and results of operations. |
| • | It is possible that our technology will have more limited performance or may take us longer to complete than is currently projected. This could materially and adversely affect our addressable markets, commercial competitiveness, and business prospects. |
| • | We expect that our business model will become less capital intensive as we transition our business to our Driver as a Service model and if that transition is delayed or does not occur, we will require significant additional capital investment to run our business. |
| • | Our services and technology may not be accepted and adopted by the market at the pace we expect or at all. |
| • | We may experience difficulties in managing our growth and expanding our operations. |
| • | Our business plans require a significant amount of capital. In addition, our future capital needs may require us to sell additional equity or debt securities that may dilute our stockholders. |
| • | We are highly dependent on the services of our senior management team and, specifically, our Chief Executive Officer, and if we are not successful in retaining our senior management team and, in particular, our Chief Executive Officer, and in attracting or retaining other highly qualified personnel, we may not be able to successfully implement our business strategy. |
| • | It is possible that Aurora’s self-driving unit economics do not materialize as expected, in particular as we transition to our Driver as a Service model. This could significantly hinder our ability to generate a commercially viable product and adversely affect our business prospects. |
-2-
| • | As part of growing our business, we have in the past and may in the future make acquisitions. If we fail to successfully select, execute or integrate our acquisitions, it could materially and adversely affect our business, prospects, financial condition and results of operations, and our stock price could decline |
| • | Our operating and financial results projections rely in large part upon assumptions and analyses developed by us. If these assumptions or analyses prove to be incorrect, our actual operating results may be materially different from our projections and our estimates of certain financial metrics may prove inaccurate. |
| • | Unauthorized control or manipulation of systems in autonomous vehicles may cause them to operate improperly or not at all, or compromise their safety and data security, which could result in loss of confidence in us and our products and harm our business. |
| • | Our future insurance coverage may not be adequate to protect us from all business risks. |
| • | Our success is contingent on our ability to successfully maintain, manage, execute and expand on our existing partnerships and obtain new partnerships. |
| • | Burdensome regulations, inconsistent regulations, or a failure to receive regulatory approvals of our technology could have a material adverse effect on our business, financial condition and results of operation. |
| • | Despite the actions we are taking to defend and protect our intellectual property, we may not be able to adequately protect or enforce our intellectual property rights or prevent unauthorized parties from copying or reverse engineering our solutions. Our efforts to protect and enforce our intellectual property rights and prevent third parties from violating our rights may be costly. |
| • | The dual class structure of Aurora common stock has the effect of concentrating voting control with the Aurora Founders. This will limit or preclude your ability to influence corporate matters, including the outcome of important transactions, including a change in control. |
| • | The Aurora projected financial information considered by RTPY prior to the Business Combination may not be realized, which may adversely affect the market price of our stock. |
Implications of Being an Emerging Growth Company
We are an “emerging growth company” as defined in the JOBS Act. As such, we may take advantage of reduced disclosure and other requirements otherwise generally applicable to public companies, including:
| • | exemption from the requirement to have our registered independent public accounting firm attest to management’s assessment of our internal control over financial reporting; |
| • | exemption from compliance with the requirement of the Public Company Accounting Oversight Board, or PCAOB, regarding the communication of critical audit matters in the auditor’s report on the financial statements; |
| • | reduced disclosure about our executive compensation arrangements; and |
| • | exemption from the requirement to hold non-binding advisory votes on executive compensation or golden parachute arrangements. |
We will remain an emerging growth company until the earliest to occur of: (1) the last day of the fiscal year in which we have at least $1.07 billion in annual revenue; (2) the date we qualify as a “large accelerated filer,” with at least $700.0 million of equity securities held by
non-affiliates;
(3) the date on which we have issued more than $1.0 billion in non-convertible
debt securities during the prior three-year period; and (4) the last day of the fiscal year ending after the fifth anniversary of the RTPY IPO. -3-
As a result of this status, we have taken advantage of reduced reporting requirements in this prospectus and may elect to take advantage of other reduced reporting requirements in our future filings with the SEC. In particular, in this prospectus, we have not included all of the executive compensation-related information that would be required if we were not an emerging growth company. In addition, the JOBS Act provides that an emerging growth company may take advantage of an extended transition period for complying with new or revised accounting standards, delaying the adoption of these accounting standards until they would apply to private companies unless it otherwise irrevocably elects not to avail itself of this exemption. We have elected to use this extended transition period for complying with new or revised accounting standards until we are no longer an emerging growth company or until we affirmatively and irrevocably opt out of the extended transition period. As a result, our financial statements may not be comparable to the financial statements of companies that comply with the new or revised accounting pronouncements as of public company effective dates.
Additional Information
Our principal executive offices are located at 50 33
rd
St, Pittsburgh, PA 152014, and our telephone number is (888) 583-9506.
Our website address is . The information on, or that can be accessed through, our website is not part of this prospectus, and you should not consider information contained on our website in deciding whether to purchase shares of our Class A Common Stock.
www.aurora.tech
-4-
THE OFFERING
Issuance of Class A Common Stock
| Non-Affiliate Conversion Stock |
234,560,193 shares |
| Former Employee Options |
425,722 shares |
| Shares of our Class A Common Stock issuable upon exercise of the Public Warrants |
12,218,750 shares |
| Use of Proceeds |
We will receive up to an aggregate of approximately $244.1 million from the exercise of all Warrants, assuming the exercise in full of such Warrants for cash and from the exercise of the Former Employee Options and Affiliate Options. We expect to use the net proceeds from the exercise of the Warrants, the Former Employee Options for general corporate purposes. See the section of this prospectus titled “ Use of Proceeds |
Issuance and Resale of Class A Common Stock
| Shares of Class A Common Stock offered by the Selling Securityholders hereunder (representing the Affiliate Conversion Stock and Affiliate Equity Stock |
247,498,882 shares |
| Shares of our Class A Common Stock issuable upon exercise of the Private Placement Warrants |
8,900,000 shares |
Resale of Class A Common Stock
| Shares of Class A Common Stock offered by the Selling Securityholders hereunder (representing the Affiliate Class A Stock, Sponsor Stock, PIPE Shares and Registration Rights Shares) |
399,468,805 shares |
| Warrants Offered by the Selling Securityholders hereunder (representing the Private Placement Warrants) |
8,900,000 warrants |
| Exercise Price of the Warrants |
$11.50 per share, subject to adjustment as described herein. |
| Redemption |
The warrants are redeemable in certain circumstances. See the section of this prospectus titled “ Description of Capital Stock–Warrants |
-5-
| Use of Proceeds |
We will not receive any proceeds from the sale of our Class A Common Stock and Warrants offered by the Selling Securityholders under this prospectus (the “Securities”). See the section of this prospectus titled “ Use of Proceeds |
| Risk Factors |
See the section titled “ Risk Factors |
| Nasdaq Symbol |
“AUR” for our Class A Common Stock and “AUROW” for our Warrants. |
| Lock-Up Restrictions |
Of the 903,072,352 shares of Class A Common Stock that may be offered or sold by Selling Securityholders identified in this prospectus, 802,952,352 of those shares (the “Lock-Up Shares”), which include shares of Class A Common Stock issuable upon the exercise or vesting of outstanding equity awards and upon conversion of Class B Common Stock, are subject to certain lock-up restrictions, pursuant to our bylaws and/or other agreements further described in the section titled “Certain Relationships and Related Person Transactions |
-6-
RISK FACTORS
Investing in our common stock involves a high degree of risk. Before making an investment decision, you should consider carefully the risks and uncertainties described below, together with all of the other information in this prospectus, including the section titled “Management’s Discussion and Analysis of Financial Condition and Results of Operations” beginning on page 58 of this prospectus and our consolidated financial statements and related notes thereto included elsewhere in this prospectus. Our business, operating results, financial condition or prospects could also be harmed by risks and uncertainties not currently known to us or that we currently do not believe are material. If any of the risks actually occur, our business, operating results, financial condition and prospects could be adversely affected. In that event, the market price of our Class A Common Stock and Public Warrants could decline, and you could lose part or all of your investment.
Risks Related to Our Technology, Business Model and Industry
Self-driving technology is an emerging technology, and we face significant technical challenges to commercialize our technology. If we cannot successfully overcome those challenges or do so on a timely basis, our ability to grow our business will be negatively impacted.
Solving self-driving is one of the most difficult engineering challenges of our generation. The industry can be characterized by a significant number of technical and commercial challenges, including an expectation driving performance, large funding requirements, long vehicle development lead times, specialized skills and expertise requirements of personnel, inconsistent and evolving regulatory frameworks, a need to build public trust and brand image, and real world operation of an entirely new technology. If we are not able to overcome these challenges, our business, prospects, financial condition, and results of operations will be negatively impacted and our ability to create a viable business may not materialize at all.
for better-than-a-human
Although we believe that our self-driving systems and supporting technology are promising, we cannot assure you that our technology will succeed commercially. The successful development of our self-driving systems and related technology involves many challenges and uncertainties, including:
| • | achieving sufficiently safe self-driving system performance as determined by us, government & regulatory agencies, our partners, customers, and the general public; |
| • | finalizing self-driving system design, specification, and vehicle integration; |
| • | successfully completing system testing, validation, and safety approvals; |
| • | obtaining additional approvals, licenses or certifications from regulatory agencies, if required, and maintaining current approvals, licenses or certifications; |
| • | receiving performance by third parties that supports our R&D and commercial activities; |
| • | preserving core intellectual property rights, while obtaining rights from third parties for intellectual property that may be critical to our R&D activities; and |
| • | continuing to fund and maintain our current technology development activities. |
We are an early stage company with a history of losses, and we expect to incur significant expenses and continuing losses for the foreseeable future.
We have incurred net losses on an annual basis since our inception. We incurred a net loss of $188.6 million for the three-month period ended March 31, 2021 and net losses of $214.5 million and $94.1 million for the years ended December 31, 2020 and 2019, respectively. We believe that we will continue to incur operating and net losses each quarter until at least the time we begin commercial operation of our self-driving technology, which may take longer than we currently expect or may never occur. Even if we successfully develop and sell our self-driving solutions, there can be no assurance that they will be commercially successful. We expect the rate at
-7-
which we will incur losses to be substantially higher in future periods as we continue to scale our development and commercialize products. Because we will incur the costs and expenses from these efforts before we receive incremental revenues with respect thereto, our losses in future periods will be significant. In addition, we may find that these efforts are more expensive than we currently anticipate or that these efforts may not result in revenues, which would further increase our losses.
Our limited operating history makes it difficult to evaluate our future prospects and the risks and challenges we may encounter.
We began operations in 2017 and have been focused on developing self-driving technology ever since. This relatively limited operating history makes it difficult to evaluate our future prospects and the risks and challenges we may encounter. Risks and challenges we have faced or expect to face include our ability to:
| • | design, develop, test, and validate our self-driving technology for commercial applications; |
| • | produce and deliver our technology at an acceptable level of safety and performance; |
| • | properly price our products and services; |
| • | plan for and manage capital expenditures for our current and future products; |
| • | hire, integrate and retain talented people at all levels of our organization; |
| • | forecast our revenue, budget for and manage our expenses; |
| • | attract new partners and retain existing partners; |
| • | navigate an evolving and complex regulatory environment; |
| • | manage our supply chain and supplier relationships related to our current and future products; |
| • | anticipate and respond to macroeconomic changes and changes in the markets in which we operate; |
| • | maintain and enhance the value of our reputation and brand; |
| • | effectively manage our growth and business operations, including the impacts of unforeseen market changes on our business; |
| • | develop and protect intellectual property; and |
| • | successfully develop new solutions, features, and applications to enhance the experience of partners and end-customers. |
If we fail to address the risks and difficulties that we face, including those associated with the challenges listed above, as well as those described elsewhere in this “” section, our business, financial condition and results of operations could be adversely affected. Further, because we have limited historical financial data and operate in a rapidly evolving market, any predictions about our future revenue and expenses may not be as accurate as they would be if we had a longer operating history or operated in a more predictable market. We have encountered in the past, and will encounter in the future, risks and uncertainties frequently experienced by growing companies with limited operating histories in rapidly changing industries. If our assumptions regarding these risks and uncertainties, which we use to plan and operate our business, are incorrect or change, or if we do not address these risks successfully, our results of operations could differ materially from our expectations and our business, financial condition and results of operations could be adversely affected.
Risk Factors
It is possible that our technology will have more limited performance or may take us longer to complete than is currently projected. This would adversely impact our addressable markets, commercial competitiveness, and business prospects.
Our products and self-driving system are technical and complex, and commercial application requires that we meet very high standards for technology performance and system safety. We may be unable to timely release
-8-
new products that meet our intended commercial use cases, and we may therefore experience more limited monetization of our technology. These risks are particularly relevant for factors such as our self-driving system’s operational domain (i.e., the conditions under which our system is designed to operate), which includes variables such as traversable road networks, speeds, and weather patterns. It is possible that there may be additional limitations in our operating capabilities depending upon a number of factors, including, for example, vehicle type (e.g. car, truck) and actor density (e.g. pedestrians, cyclists). If that is the case, we may be more restricted in our addressable market opportunities.
Commercial deployment has taken longer in the self-driving industry than anticipated, and it may take us more time to complete our own technology development and commercialization than is currently projected. The achievement of broadly applicable self-driving technology will require further technology improvements including, for example,
handling non-compliant or
unexpected actor behavior and inclement weather conditions. These improvements may take us longer than expected which would increase our capital requirements for technology development, delay our timeline to commercialization, and reduce the potential financial returns that may be expected from the business. We operate in a highly competitive market and some market participants have substantially greater resources. If one or more of our competitors commercialize their self-driving technology before we do, develop superior technology, or are perceived to have better technology, our business prospects and financial performance would be adversely affected.
The market for self-driving technology is highly competitive and can be characterized by rapid technological change. Our future success will depend on our ability to develop and commercialize in a timely manner in order to stay ahead of existing and new competitors. Several companies, including, but not limited to, Waymo, GM Cruise, TuSimple, Tesla, Zoox/Amazon, Argo AI, Apple, Motional, Pony.ai, Intel Mobileye, Nuro, and Embark are investing heavily in building this technology. These companies compete with us directly by offering self-driving technology for the same or similar use cases. If our competitors, including those previously mentioned, commercialize their technology before we do, develop superior technology, or are perceived to have better technology, they may capture market opportunities and establish relationships with customers and partners that might otherwise have been available to us.
Material commercialization of self-driving technology first involves pilot deployments and some of our competitors are operating such pilots. Other competitors may initiate similar deployments in various use cases or geographies earlier than we will. Several of these competitors have substantial financial, marketing, R&D, and other resources. In the event that one or many of these competitors broadly commercializes their technology before we do, our business prospects and financial performance would be adversely impacted.
Our services and technology may not be accepted and adopted by the market at the pace we expect or at all.
Self-driving technology is still nascent and is neither generally understood nor universally accepted. We are at risk of adverse publicity that stems from any public incident involving self-driving vehicles (whether involving Aurora or a competitor), which could result in decreased
end-customer
demand for our technology. Part of our commercialization plan includes public awareness and education campaigns, but this guarantees neither public nor customer acceptance of our services. If we cannot gain sufficient trust in our technology, we will be unable to commercialize as intended. We may also experience adverse publicity that argues self-driving technology is replacing human jobs and disrupting the economy. Such media attention could cause current and future partners to terminate their business with us, which would significantly impact our ability to make future sales. Further, as the market for self-driving cars develops, the differences in the approaches of Aurora and others will become more widely known to suppliers, insurers, regulators and others. Until these distinctions are known and appreciated, the actions of a single market participant may be imputed to the self-driving industry as a whole. As such, as a result of an action or inaction by a third-party, it is possible that suppliers, insurers, regulators and
-9-
others may refuse or cease to interact with or conduct business with the self-driving industry as a whole, including Aurora.
If the market does not accept and adopt our services and technology at the pace we expect or at all, it could materially and adversely affect our business, prospects, financial condition and results of operations.
We expect that our business model will become less capital intensive as we transition our business to our Driver as a Service model and if that transition is delayed or does not occur, we will require significant additional capital investment to run our business.
Our business plan envisions
a two-phase process
for ownership and operation of Aurora-powered self-driving vehicles. Early in our commercialization, we intend to own or lease and operate a limited fleet and will invest in self-driving system hardware, base vehicles, and commercial facilities (such as freight terminals). We believe this firsthand experience will help us to harden our operational processes, service level agreements, and enable a more effective transition to working with external partners on operational activities. After this initial period of Aurora ownership and operation, we expect to transition to a Driver as a Service business model. Under this model, one or more third-party partners would own and operate Aurora-powered vehicles and would also manage activities such as financing, maintenance, cleaning, and fleet facilities. Since it is more capital-intensive for us to own or lease and operate our own fleet of vehicles, any delay in the transition to the Driver as a Service model will require additional investments of capital and could mean we may not be able to reach scale as quickly as projected. In addition, it is possible that we may be required to fund and operate commercial facilities as part of our product offering, as opposed to partnering with third parties. Although we believe, based on partner discussions, that such a transition will be possible in our intended timeframes, there is no guarantee that third parties will be able or willing to own and operate Aurora-powered vehicles as soon or ramp as quickly as expected at desirable commercial terms. Similarly, we expect to partner with other third parties who will own and operate terminal facilities, but we may determine that we will need to own or operate more of these facilities ourselves. Such difficulties could have adverse impacts on our business, prospects, financial condition, and growth potential. As such, this model may present unpredictable challenges associated with third-party dependency which could materially and adversely affect our business, financial condition and results of operations.
It is possible that Aurora’s self-driving unit economics do not materialize as expected, in particular as we transition to our Driver as a Service model. This could significantly hinder our ability to generate a commercially viable product and adversely affect our business prospects.
Our business model is premised on our future expectations and assumptions regarding unit economics of the Aurora Driver and our transition, including the timing thereof, to our Driver as a Service model. There are uncertainties in these assumptions and we may not be able to achieve the unit economics we expect for many reasons, including but not limited to:
| • | costs of the self-driving system hardware; |
| • | other fixed and variable costs associated with self-driving vehicle operation; |
| • | useful life; |
| • | vehicle utilization; and |
| • | product pricing. |
To manage self-driving hardware costs, we must engineer cost-effective designs for our sensors, computers, and vehicles, achieve adequate scale, and freeze hardware specifications while enabling continued software improvements. In addition, we must continuously push initiatives to optimize supporting cost components such
-10-
as vehicle and SDS maintenance, cloud storage, telecom data feed, facilities, cleaning, operations personnel costs, and useful life. This will require significant coordination with our third-party fleet partners and adequate cost management may not materialize as expected or at all, which would have material adverse effects on our business prospects.
Self-driving technology is a new product and the appropriate price points are still being determined. Additionally, increased competition may result in pricing pressure and reduced margins and may impede our ability to increase the revenue of our technology or cause us to lose market share, any of which could materially and adversely affect our business, financial condition and results of operations. Unfavorable changes in any of these or other unit economics-related factors, many of which are beyond our control, could materially and adversely affect our business, prospects, financial condition and results of operations.
We are highly dependent on the services of our senior management team and, specifically, our Chief Executive Officer, and if we are not successful in retaining our senior management team and, in particular, our Chief Executive Officer, and in attracting or retaining other highly qualified personnel, we may not be able to successfully implement our business strategy.
Our success depends, in significant part, on the continued services of our senior management team, which has extensive experience in the self-driving industry. The loss of any one or more members of our senior management team, for any reason, including resignation or retirement, could impair our ability to execute our business strategy and could materially and adversely affect our business, financial condition and results of operations. In particular, we are highly dependent on Chris Urmson, our Founder, President and Chief Executive Officer, who remains deeply involved in all aspects of our business, including product development. If Mr. Urmson ceased to be involved with Aurora, this would adversely affect our business because his loss could make it more difficult to, among other things, compete with other market participants, manage our R&D activities and retain existing partners or cultivate new ones. Negative public perception of, or negative news related to, Mr. Urmson may adversely affect our brand, relationship with partners or standing in the industry.
Our success similarly hinges on the ability to attract, motivate, develop and retain a sufficient number of other highly skilled personnel, including software, hardware, systems engineering, automotive, safety, operations, design, finance, marketing, and support personnel. Competition for qualified highly skilled personnel can be strong, and we can provide no assurance that we will be successful in attracting or retaining such personnel now or in the future. Employees may be more likely to leave us if the shares of our capital stock they own or the shares of our capital stock underlying their equity incentive awards have significantly reduced in value or the vested shares of our capital stock they own or vested shares of our capital stock underlying their equity incentive awards have significantly appreciated. Many of our employees may receive significant proceeds from sales of our equity in the public markets once the
applicable lock-up
restrictions expire, which may reduce their motivation to continue to work for us. Further, any inability to recruit, develop and retain qualified employees may result in high employee turnover and may force us to pay significantly higher wages, which may harm our profitability. Additionally, we do not carry key man insurance for any of our management executives, and the loss of any key employee or our inability to recruit, develop and retain these individuals as needed, could materially and adversely affect our business, financial condition and results of operations.
Risks Related to Our Business and Industry
Our business plans require a significant amount of capital. In addition, our future capital needs may require us to sell additional equity or debt securities that may dilute our stockholders.
The fact that we have a limited operating history means we have limited historical data on the demand for our products and services. As a result, our future capital requirements are uncertain and actual capital
-11-
requirements may be different from those we currently anticipate. We expect to continue investing in research and development to improve our self-driving technology. We expect we will need to seek equity or debt financing to fund a portion of our future expenditures. Such financing might not be available to us in a timely manner, on terms that are acceptable, or at all.
Our ability to obtain the necessary financing to carry out our business plan is subject to a number of factors, including general market conditions and investor acceptance of our business model. These factors may make the timing, amount, terms and conditions of such financing unattractive or unavailable to us. If we are unable to raise sufficient funds, we will have to significantly reduce our spending, delay or cancel our planned activities, or substantially change our corporate structure.
We may experience difficulties in managing our growth and expanding our operations.
We expect to experience significant growth in the scope and nature of our operations. Our ability to manage our operations and future growth will require us to continue to improve our operational, financial and management controls, compliance programs and systems automation. We are currently in the process of strengthening our compliance programs, including in relation to export controls, privacy and cybersecurity and anti-corruption. We will also need to reduce our reliance on manual operations in the areas of billing and reporting and make certain other improvements to support our complex arrangements and the rules governing revenue and expense recognition for our future operations. We may not be able to implement improvements in an efficient or timely manner and may discover deficiencies in existing controls, programs, systems and procedures, which could have an adverse effect on the accuracy of our reporting, business relationships, reputation and financial results.
Our operating and financial results projections rely in large part upon assumptions and analyses developed by us. If these assumptions or analyses prove to be incorrect, our actual results of operations may be materially different from our projections and our estimates of certain financial metrics may prove inaccurate.
We use various estimates in formulating our business plans. We base our estimates upon a number of assumptions that are inherently subject to significant business and economic uncertainties and contingencies, many of which are beyond our control. Our estimates therefore may prove inaccurate, causing the actual amount to differ from our estimates. These factors include, without limitation:
| • | assumptions around vehicle miles traveled (“VMT”); |
| • | the degree of utilization achieved by our self-driving technology; |
| • | the price our customers are willing to pay; |
| • | the timing and breadth of our technology’s operating domain and product models; |
| • | operational costs of our self-driving technology and their useful life; |
| • | growth in core development and operating expenses; |
| • | which elements of service are delivered by Aurora versus our partners, and associated impact on expenses and capital requirements; |
| • | the extent to which our technology is successfully and efficiently operationalized by our fleet partners, and our market penetration more broadly; |
| • | the timing of when our partners and end-customers adopt our technology on a commercial basis which could be delayed for regulatory, safety or reliability issues unrelated to our technology; |
| • | the timing of future self-driving system hardware generations and vehicle platforms; |
| • | competitive pricing pressures, including from established and future competitors; |
-12-
| • | whether we can obtain sufficient capital to continue investing in core technology development and sustain and grow our business; |
| • | the overall strength and stability of domestic and international markets, including, but not limited to trucking, passenger mobility, and local goods delivery; and |
| • | other risk factors set forth in this prospectus. |
In particular, our total addressable market and opportunity estimates, growth forecasts, pricing, cost, and customer demand included in this registration statement are subject to significant uncertainty and are based on assumptions and estimates that may prove inaccurate. The projections, forecasts and estimates in this registration statement relating to the expected size and growth of the markets for self-driving technology may prove similarly imprecise. We are pursuing prospects in multiple markets that are undergoing rapid changes, including in technological and regulatory areas, and it is difficult to predict the timing and size of the opportunities.
Unfavorable changes in any of the above or other factors, including around the total addressable market and market opportunity, most of which are beyond our control, could materially and adversely affect our business, prospects, financial condition and results of operations.
As part of growing our business, we have in the past and may in the future make acquisitions. If we fail to successfully select, execute or integrate our acquisitions, it could materially and adversely affect our business, financial condition and results of operations, and our stock price could decline.
From time to time, we may undertake acquisitions to add new products and technologies, acquire talent, form new strategic partnerships, or enter into new markets or geographies. In addition to possible stockholder approval, we may need approvals and licenses from relevant government authorities for such future acquisitions and to comply with any applicable laws and regulations, which could result in increased delay and costs, and may disrupt our business strategy if such approvals are ultimately denied. Furthermore, acquisitions and the subsequent integration of new assets, businesses, key personnel, partners
and end-customers, vendors
and suppliers require significant attention from our management and could result in a diversion of resources from our existing business, which in turn could have an adverse effect on our operations. Additionally, acquired assets or businesses may not generate the financial results we expect. Key personnel or large numbers of employees who join Aurora through acquisitions may decide to leave Aurora to work for other businesses or competitors of Aurora, thereby diminishing the value of our acquisitions. Acquisitions could result in the use of substantial amounts of cash, potentially dilutive issuances of equity securities, the occurrence of significant goodwill impairment charges, amortization expenses for other intangible assets and exposure to potential unknown liabilities of the acquired business. For example, in January 2021, Aurora acquired Uber’s self driving unit, Apparate, an acquisition for which many of the risks outlined above were, and continue to be, present. Apparate has a history of financial losses, which have (and will continue to) lead to increased losses for Aurora (versus if Aurora had not acquired Apparate), and which have and will require increased cash spending by Aurora. There are risks in retaining and integrating key personnel and teams, and risks and delay involved in properly and efficiently aligning and utilizing the teams of the combined entity. Further, Apparate and Aurora have a substantial amount of software, hardware, services and systems that are redundant, or not necessarily complementary. Additionally, the acquisition and integration processes create a risk that management and employees of Aurora become distracted. Finally, the costs of identifying and consummating acquisitions may be significant. Failure to successfully identify, complete, manage and integrate acquisitions could materially and adversely affect our business, prospects, financial condition and results of operations, and could cause our stock price to decline. -13-
Our business is subject to the risks of earthquakes, fire, floods and other natural catastrophic events, global pandemics, and interruptions
by man-made
problems, such as terrorism. Material disruptions of our business or information systems resulting from these events could materially and adversely affect our business, financial condition and results of operations. A significant natural disaster, such as an earthquake, fire, flood, hurricane or significant power outage or other similar events, such as infectious disease outbreaks or pandemic events, including ” section, such as the demand for our products, our ability to achieve or maintain profitability and our ability to raise additional capital in the future. We further note we have several offices located in the San Francisco Bay Area, a region known for seismic activity. In addition, natural disasters, acts of terrorism or war could cause disruptions in our remaining operations, our or our partners’ businesses, our suppliers’ or the economy as a whole. We also rely on information technology systems to communicate among our workforce and with third parties. Any disruption to our communications, whether caused by a natural disaster or
the COVID-19
pandemic and its aftermath, could materially and adversely affect our business, financial condition and results of operations. The COVID-19
pandemic and its aftermath may have the effect of heightening many of the other risks described in this “Risk Factors
by man-made
problems, such as power disruptions, could adversely affect our business. We do not have a formal disaster recovery plan or policy in place and do not currently require that our partners have such plans or policies in place. To the extent that any such disruptions result in development or commercialization delays or impede our partners’ and suppliers’ ability to timely deliver product components, or the deployment of our products, this could materially and adversely affect our business, financial condition and results of operations. The spread of COVID-19
caused us to modify our business practices (including reducing employee travel, recommending that all non-essential
personnel work from home and cancellation or reduction of physical participation in activities, meetings, events and conferences), and we may take further actions as may be required by government authorities or that we determine are in the best interests of our employees, partners and end-customers,
suppliers, and business partners. The COVID-19
pandemic could limit the ability of our partners, suppliers, and business partners to perform, including our ability to conduct on-road
and track operations for development testing. Even after
the COVID-19 pandemic
has subsided, we may continue to experience an adverse impact to our business as a result of its global economic impact, including any recession that has occurred or may occur in the future. We do not yet know the full extent of COVID-19’s
impact on our business, our operations, or the global economy as a whole. However, the effects could materially and adversely affect our business, financial condition and results of operations, and we will continue to monitor the situation closely. Interruption or failure of Amazon Web Services or other information technology and communications systems that we rely upon could materially and adversely affect our business, financial condition and results of operations.
We currently rely on Amazon Web Services, or AWS, to host our technology and support our technology development. The availability and effectiveness of our services depend on the continued operation of AWS, information technology, and communications systems. Our systems will be vulnerable to damage, interruption or any other compromise as the result of, among others, physical theft, fire, terrorist attacks, natural disasters, power loss, war, telecommunications failures, viruses, denial or degradation of service attacks, ransomware, social engineering schemes, insider theft or misuse or other attempts to harm our systems. We utilize reputable third-party service providers or vendors for all of our data other than our source code, and these providers could also be vulnerable to harms similar to those that could damage our systems, including sabotage and intentional acts of vandalism causing potential disruptions. It may become increasingly difficult to maintain and improve our performance, especially during peak usage times, as we expand the usage of our platform. Some of our systems will not be fully redundant, and our disaster recovery planning cannot account for all eventualities. Any problems with our third-party cloud hosting providers could result in lengthy interruptions in our business.
-14-
We are subject to cybersecurity risks to operational systems, security systems, infrastructure, integrated software and partners and
end-customers data
processed by us or third-party vendors or suppliers and any material failure, weakness, interruption, cyber event, incident or breach of security could prevent us from effectively operating our business. We are at risk for interruptions, outages and breaches of: operational systems, including business, financial, accounting, product development, data processing or production processes, owned by us or our third-party vendors or suppliers; facility security systems, owned by us or our third-party vendors or
suppliers; in-product technology
owned by us or our third-party vendors or suppliers; our integrated software; or partners or end-customers or
driver data that we process or our third-party vendors or suppliers process on our behalf. Such cyber incidents could materially disrupt operational systems; result in loss of intellectual property, trade secrets or other proprietary or competitively sensitive information; compromise certain information of partners, end-customers, employees,
suppliers, drivers or others; jeopardize the security of our facilities; or affect the performance of in-product technology.
A cyber incident could be caused by disasters, insiders (through inadvertence or with malicious intent) or malicious third parties (including nation-states or nation-state supported actors) using sophisticated, targeted methods to circumvent firewalls, encryption and other security defenses, including hacking, fraud, trickery or other forms of deception. The techniques used by cyber attackers change frequently and may be difficult to detect for long periods of time. Although we maintain and continue to develop information technology measures designed to protect us against intellectual property theft, data breaches and other cyber incidents, including a formal incident response plan, such measures will require updates and improvements, and we cannot guarantee that such measures will be adequate to detect, prevent or mitigate cyber incidents. The implementation, maintenance, segregation and improvement of these systems requires significant management time, support and cost. Moreover, there are inherent risks associated with developing, improving, expanding and updating current systems, including the disruption of our data management, procurement, production execution, finance, supply chain and sales and service processes. These risks may affect our ability to manage our data and inventory, procure parts or supplies or produce, sell, deliver and service our solutions, adequately protect our intellectual property or achieve and maintain compliance with, or realize available benefits under, applicable laws, regulations and contracts. We cannot be sure that the systems upon which we rely, including those of our third-party vendors or suppliers, will be effectively implemented, maintained or expanded as planned. If we do not successfully implement, maintain or expand these systems as planned, our operations may be disrupted, our ability to accurately and timely report our financial results could be impaired, and deficiencies may arise in our internal control over financial reporting, which may impact our ability to certify our financial results. Moreover, our proprietary information or intellectual property could be compromised or misappropriated, and our reputation may be adversely affected. If these systems do not operate as we expect them to, we may be required to expend significant resources to make corrections or find alternative sources for performing these functions.
A significant cyber incident could impact production capability, harm our reputation, cause us to breach our contracts with other parties or subject us to regulatory actions or litigation, any of which could materially and adversely affect our business, financial condition and results of operations. In addition, our insurance coverage for cyber-attacks may not be sufficient to cover all the losses we may experience as a result of a cyber incident.
Unauthorized control or manipulation of systems in autonomous vehicles may cause them to operate improperly or not at all, or compromise their safety and data security, which could result in loss of confidence in us and our products and harm our business.
There have been reports of vehicles being “hacked” to grant access to and operation of the vehicles to unauthorized persons. Aurora-powered vehicles contain complex IT systems and are designed
with built-in data
connectivity. We are implementing security measures intended to prevent unauthorized access to the information technology networks and systems installed in our vehicles. However, hackers or unauthorized third parties may attempt to gain unauthorized access to modify, alter, and use such networks and systems to gain control of, or to -15-
change, our vehicles’ functionality, user interface and performance characteristics, or to access data stored in or generated by our products. As techniques used to obtain unauthorized access to or sabotage systems change frequently and may not be known until launched against us or our third-party service providers, there can be no assurance that we will be able to anticipate, or implement adequate measures to protect against, these attacks. Any such security incidents could result in unexpected control of or changes to the vehicles’ functionality and safe operation and could result in legal claims or proceedings and negative publicity, which would negatively affect our brand and harm our business, prospects, financial condition, and operating results.
Failures, or perceived failures, to comply with privacy, data protection, and information security requirements in the variety of jurisdictions in which we operate, or may operate, may adversely impact our business, and such legal requirements are evolving, uncertain and may require improvements in, or changes to, our policies and operations.
Our current and potential future operations and sales subject us to laws and regulations addressing privacy and the collection, use, storage, disclosure, transfer and protection of a variety of types of data. For example, the European Commission has adopted the General Data Protection Regulation and California enacted the California Consumer Privacy Act of 2018, both of which provide for potentially material penalties
for non-compliance.
We may also be subject to additional privacy regulations in the future, including the California Privacy Rights Act of 2020 (when it goes into effect in 2023) or the Virginia Consumer Data Protection Act (when it goes into effect in 2023). These regimes may, among other things, impose data security requirements, disclosure requirements, and restrictions on data collection, uses, and sharing that may impact our operations and the development of our business. While, generally, we do not have access to, collect, store, process, or share information collected by our solutions unless our partners choose to proactively provide such information to us, our products may evolve both to address potential partner requirements or to add new features and functionality that may change our privacy obligations. Therefore, the full impact of these privacy regimes on our business is rapidly evolving across jurisdictions and remains uncertain at this time.
We may also be affected by cyber-attacks and other means of gaining unauthorized access to our technology, systems, and data. For instance, cyber criminals, insiders or unauthorized third parties may target us or third parties with which we have business relationships to obtain data, or in a manner that disrupts our operations or compromises our products or the systems into which our products are integrated.
We are assessing the continually evolving privacy and data security regimes and measures we believe are appropriate in response. Since these data security regimes are evolving, uncertain and complex, especially for a global business like ours, we may need to update or enhance our compliance measures as our products, markets
and end-customer demands
further develop, and these updates or enhancements may require implementation costs. In addition, we may not be able to monitor and react to all developments in a timely manner. The compliance measures we do adopt may prove ineffective. Any failure, or perceived failure, by us to comply with current and future regulatory, partner or end-customer-driven privacy,
data protection, and information security requirements, or to prevent or mitigate security breaches, cyber-attacks, or improper access to, use of, or disclosure of data, or any security issues or cyber-attacks affecting us, could result in significant liability, costs (including the costs of mitigation and recovery), and a material loss of revenue resulting from the adverse impact on our reputation and brand, loss of proprietary information and data, disruption to our business and relationships, and diminished ability to retain or attract partners and end-customers. Such
events may result in governmental enforcement actions and prosecutions, private litigation, fines and penalties or adverse publicity, and could cause partners and end-customers to
lose trust in us, which could have an adverse effect on our reputation and business. -16-
Our future insurance coverage may not be adequate to protect us from all business risks or may be prohibitively expensive.
We may be subject, in the ordinary course of business, to losses resulting from product liability, accidents, acts of God, and other claims against us, for which we may have no insurance coverage. Further, because we operate in a new and thus inherently risky industry, insurance policies may not be available to us on terms and rates that are acceptable to us or at all. In addition, as a general matter, the policies that we do have may include significant deductibles or self-insured retentions, and we cannot be certain that our future insurance coverage will be sufficient to cover all future losses or claims against us. A loss that is uninsured or which exceeds policy limits may require us to pay substantial amounts, which could materially and adversely affect our business, financial condition and results of operations. Further, actions or inactions of others in our industry, through no fault of our own, may materially increase the cost of insurance and/or materially decrease the coverages available to us on commercially reasonable terms.
Any financial or economic crisis, or perceived threat of such a crisis, including a significant decrease in consumer confidence, could materially and adversely affect our business, financial condition and results of operations.
In recent years, the United States and global economies suffered dramatic downturns as the result of
the COVID-19 pandemic,
a deterioration in the credit markets and related financial crisis as well as a variety of other factors including, among other things, extreme volatility in security prices, severely diminished liquidity and credit availability, ratings downgrades of certain investments and declining valuations of others. The United States and certain foreign governments have taken unprecedented actions in an attempt to address and rectify these extreme market and economic conditions by providing liquidity and stability to the financial markets. If the actions taken by these governments are not successful, the return of adverse economic conditions may negatively impact the demand for our technology and may negatively impact our ability to raise capital, if needed, on a timely basis and on acceptable terms or at all. Unanticipated changes in effective tax rates, adverse outcomes resulting from examination of our income, changes in tax laws or regulations, changes in our ability to utilize our net operating loss, or
other tax-related changes
could materially and adversely affect our business, prospects, financial condition and results of operations. We will be subject to income taxes in the United States and other jurisdictions, and our tax liabilities will be subject to the allocation of expenses in differing jurisdictions. Our future effective tax rates could be subject to volatility or adversely affected by a number of factors, including changes in the valuation of our deferred tax assets and liabilities; expected timing and amount of the release of any tax valuation allowances; tax effects of stock-based compensation; changes in tax laws, regulations or interpretations thereof; or lower than anticipated future earnings in jurisdictions where we have lower statutory tax rates and higher than anticipated future earnings in jurisdictions where we have higher statutory tax rates.
In addition, we may be subject to audits of our income, sales and other transaction taxes by taxing authorities. Outcomes from these audits could materially and adversely affect our business, prospects, financial condition and results of operations.
Our future effective tax rates could be affected by changes in the mix of earnings in countries with differing statutory tax rates, changes in the valuation of deferred tax assets and liabilities and changes in tax laws or their interpretation. In addition, we may be subject to income tax audits by various tax jurisdictions. Although we believe our income tax liabilities are reasonably estimated and accounted for in accordance with applicable laws and principles, an adverse resolution by one or more taxing authorities could have a material impact on the results of our operations.
In general, under Section 382 of the Code, a corporation that undergoes an “ownership change” is subject to limitations on its ability to use
its pre-change net
operating loss carryforwards, NOLs, to offset future taxable income. The limitations apply if a corporation undergoes an “ownership change,” which is generally defined as a -17-
greater than 50 percentage point change (by value) in its equity ownership by certain stockholders over a three-year period. If we have experienced an ownership change at any time since our incorporation, we may already be subject to limitations on our ability to utilize our existing NOLs and other tax attributes to offset taxable income or tax liability. In addition, the Business Combination and future changes in our stock ownership, which may be outside of our control, may trigger an ownership change. Similar provisions of state tax law may also apply to limit our use of accumulated state tax attributes. As a result, even if we earn net taxable income in the future, our ability to use these or
our pre-change NOL
carryforwards and other tax attributes to offset such taxable income or tax liability may be subject to limitations, which could potentially result in increased future income tax liability to us. There is also a risk that changes in law or regulatory changes made in response to the need for some jurisdictions to raise additional revenue to help counter the fiscal impact from
the COVID-19 pandemic
or for other unforeseen reasons, including suspensions on the use of net operating losses or tax credits, possibly with retroactive effect, may result in our existing net operating losses or tax credits expiring or otherwise being unavailable to offset future income tax liabilities. A temporary suspension of the use of certain net operating losses and tax credits has been enacted in California, and other states may enact suspensions as well. Risks Related to Our Dependence on Third Parties
Our success is contingent on our ability to successfully maintain, manage, execute and expand on our existing partnerships and obtain new partnerships.
Our self-driving technology is integrated into the vehicles of our OEM partners, while logistics services partners, ride-sharing partners and fleet service partners can act as both a customer and an operator of Aurora-powered vehicles. While we are providing our self-driving technology to these partners, they are simultaneously providing their vehicles, fleet operational activities, and, in some cases, access to
end-customers.
In order for this business model to be successful, we will need to enter into definitive long-term contracts and commercial arrangements with partners such as PACCAR, Uber, Toyota and Volvo, which expand upon the current agreements and historic working relationships we have in place. In the event such contracts do not materialize, we may not be able to implement our business strategy in the timeframe anticipated, or at all. If we are unable to enter into definitive agreements or are only able to do so on terms that are unfavorable to us, we may not be able to timely identify adequate strategic relationship opportunities, or form strategic relationships, and consequently, we may not be able to fully carry out our business plans. Accordingly, investors should not place undue reliance on our statements about our development plans and partnerships or their feasibility in the timeframe anticipated, or at all.
Partners
and end-customers may
be less likely to purchase our products if they are not convinced that our business will succeed or that our service, technology, and other operations will continue in the long term. Similarly, suppliers and other third parties will be less likely to invest time and resources in developing business relationships with us if they are not convinced that our business will succeed. Accordingly, in order to build and maintain our business, we must maintain confidence among partners, end-customers, suppliers,
analysts, ratings agencies and other parties in our products, long-term financial viability and business prospects. Maintaining such confidence may be particularly complicated by certain factors including those that are largely outside of our control, such as our limited operating history, end-customer unfamiliarity
with our technology, any delays in scaling production, delivery and service operations to meet demand, competition and uncertainty regarding the future of self-driving vehicles or our other services compared with market expectations. We are dependent on our suppliers, some of which are single or limited source suppliers, and the inability of these suppliers to produce and deliver necessary and industrialized components at prices and volumes and on terms acceptable to us could materially and adversely affect our business, prospects, financial condition and results of operations.
While we plan to obtain components from multiple sources whenever desirable, some of the components used in our hardware and technology will be purchased from a single supplier. We refer to these component
-18-
suppliers as our single source suppliers. These components are susceptible to supply shortages, long lead times for components, and supply changes, any of which could disrupt our supply chain and could delay commercialization of our products to users. For example, the Aurora Driver relies on single source suppliers for several components including GPU microchips which we use for machine learning inference, vehicle gateway electronic control units, and automotive radar sensors.
We are reliant on third-party suppliers to design, develop, industrialize and manufacture components for us. In order for these suppliers to undertake the investment needed to produce these components, they may require us to commit to terms, pricing or purchase volumes that are not acceptable to us.
While we believe that we may be able to establish alternate supply relationships and can obtain or engineer replacement components for our single source and other components, we may be unable to do so in the short term (or at all) at prices or quality levels and/or on terms that are favorable to us and we may experience significant delays
while re-engineering our
system to accept any replacement parts. Manufacturing in collaboration with partners is subject to risks.
Our business model relies on outsourced manufacturing of vehicles and will include outsourced manufacturing of our self-driving system hardware and vehicle integration. The cost of tooling a manufacturing facility with a collaboration partner is high, but the exact dollar value will not be known until we enter into specific manufacturing agreements. Collaboration with third parties to manufacture vehicles and self-driving system hardware is subject to risks that are outside of our control. We have in the past, and could in the future, experience delays in development and production when and if our partners do not meet agreed upon timelines or experience capacity constraints. There is a risk of potential disputes with partners, which could stop or slow vehicle production, and we could be affected by adverse publicity related to our partners, whether or not such publicity is related to such third parties’ collaboration with us. In addition, we cannot guarantee that our suppliers will not deviate from agreed-upon quality standards.
We may be unable to enter into agreements with manufacturers on terms and conditions acceptable to us and therefore we may need to contract with other third parties or significantly add to our own production capacity. We may not be able to engage other third parties or establish or expand our own production capacity to meet our needs on acceptable terms, or at all. The expense and time required to adequately complete any transition may be greater than anticipated. Any of the foregoing could materially and adversely affect our business, financial condition and results of operations.
Risks Related to Our Legal and Regulatory Environment
Burdensome regulations, inconsistent regulations, or a failure to receive regulatory approvals of our technology could have a material adverse effect on our business, financial condition and results of operation.
There has been relatively little mandatory government regulation of the self-driving
industry to-date. Currently,
there are no Federal Motor Vehicle Safety Standards (“FMVSS”) that relate to the performance of self-driving technology. Further, there are currently no widely accepted uniform standards to certify self-driving technology and its commercial use on public roads. While our team includes nationally recognized safety experts and we have built organizational, operational, and safety processes to ensure that the performance of our technology meets rigorous standards, there can be no assurance that these measures will meet future regulatory requirements enacted by government bodies nor that future regulatory requirements will not inherently limit the operation and commercialization of self-driving technology. In some jurisdictions, we could be required to present our own safety justification and evidence base, and in other areas it is possible that we may be required to pass specific self-driving safety tests. We have not yet tested our technology to the full extent possible, in all conditions under which we anticipate operations to occur. The failure to pass these safety tests or receive appropriate regulatory approvals for commercialization would adversely impact our ability to generate revenue at the rate we anticipate. -19-
It is also possible that future self-driving regulations are not standardized, and our technology becomes subject to differing regulations across jurisdictions (e.g. federal, state, local, and international). For example, in Europe, certain vehicle safety regulations apply to automated braking and steering systems, and certain treaties also restrict the legality of certain higher levels of automation, while certain U.S. states have legal restrictions on automation, and many other states are considering them. Such a regulatory patchwork could hinder the commercial deployment of our technology and have adverse effects on our business prospects and financial condition.
We are also subject to laws and regulations that commonly apply
to e-commerce businesses,
such as those related to privacy and personal information, tax and consumer protection. These laws and regulations vary from one jurisdiction to another and future legislative and regulatory action, court decisions or other governmental action, which may be affected by, among other things, political pressures, attitudes and climates, as well as personal biases, may have a material impact on our operations and financial results. We are subject to governmental export and import control laws and regulations. Our failure to comply with these laws and regulations could materially and adversely affect our business, prospects, financial condition and results of operations.
Our products and solutions are subject to export control and import laws and regulations, including the U.S. Export Administration Regulations, U.S. Customs regulations and various economic and trade sanctions regulations administered by the U.S. Treasury Department’s Office of Foreign Assets Controls. U.S. export control laws and regulations and economic sanctions prohibit the shipment of certain products and services to U.S. embargoed or sanctioned countries, governments and persons. In addition, complying with export control and sanctions regulations for a particular geography may be time-consuming and result in the delay or loss of revenue opportunities. Exports of our products and technology must be made in compliance with these laws and regulations. If we fail to comply with these laws and regulations, we and certain of our employees could be subject to substantial civil or criminal penalties, including the possible loss of export or import privileges, fines, which may be imposed on us and responsible employees or managers and, in extreme cases, the incarceration of responsible employees or managers.
We may become involved in legal and regulatory proceedings and commercial or contractual disputes, which could have an adverse effect on our profitability and consolidated financial position.
We may be, from time to time, involved in litigation, regulatory proceedings and commercial or contractual disputes that may be significant. These matters may include, without limitation, disputes with our suppliers and partners, intellectual property claims, stockholder litigation, government investigations, class action lawsuits, personal injury claims, environmental issues, customs and value-added tax disputes and employment and tax issues. In addition, we have in the past and could face in the future a variety of labor and employment claims against us, which could include but is not limited to general discrimination, wage and hour, privacy, ERISA or disability claims. In such matters, government agencies or private parties may seek to recover from us very large, indeterminate amounts in penalties or monetary damages (including, in some cases, treble or punitive damages) or seek to limit our operations in some way. These types of disputes could require significant management time and attention or could involve substantial legal liability, adverse regulatory outcomes, and/or substantial expenses to defend. Often these proceedings raise complex factual and legal issues and create risks and uncertainties. No assurances can be given that any proceedings and claims will not have a material and adverse impact on our business, financial condition or results of operations or that our established reserves or our available insurance will mitigate this impact.
Changes to global political, regulatory and economic conditions or foreign laws and policies, or interpretation of existing foreign laws and policies, could materially and adversely affect our business, prospects, financial condition and results of operations.
Changes in global political, regulatory and economic conditions or in laws and policies governing foreign trade, research, manufacturing, development, technology, and investment in the territories or countries where we
-20-
currently purchase our components, sell our products or conduct our business could adversely affect our business. The U.S. has recently instituted or proposed changes in trade policies that include the negotiation or termination of trade agreements, the imposition of higher tariffs on imports into the U.S., economic sanctions on individuals, corporations or countries, and other government regulations affecting trade between the U.S. and other countries where we conduct our business. A number of other nations have proposed or instituted similar measures directed at trade with the United States in response. As a result of these developments, there may be greater restrictions and economic disincentives on international trade that could adversely affect our business. Additionally, certain existing and future foreign political, regulatory and economic conditions may make it impractical or impossible to launch in certain markets, may delay our launch in certain markets, or may impose onerous conditions to launch in such markets (e.g., requiring a local partner and/or the disclosure of sensitive intellectual property assets). It may be time-consuming and expensive for us to alter our business operations to adapt to or comply with any such changes, and any failure to do so could materially and adversely affect our business, financial condition and results of operations.
We are subject to, and must remain in compliance with, numerous laws and governmental regulations concerning the manufacturing, use, distribution and sale of our products. Some of our partners also require that we comply with their own unique requirements relating to these matters.
We develop and plan to sell technology that contains electronic components, and such components may be subject to or may contain materials that are subject to government regulation in both the locations where manufacture and assembly of our products takes place, as well as the locations where we sell our products. This is a complex process which requires continual monitoring of regulations to ensure that we and our suppliers are in compliance with existing regulations in each market where we operate and where we intend to operate. If there is an unanticipated new regulation that significantly impacts our use and sourcing of various components or requires more expensive components, that regulation could materially and adversely affect our business, prospects, financial condition and results of operations. If we fail to adhere to new regulations or fail to continually monitor the updates, we may be subject to litigation, loss of partners or negative publicity and could materially and adversely affect our business, financial condition and results of operations.
We are subject to environmental regulation and may incur substantial costs.
We are subject to federal, state, local and foreign laws, regulations and ordinances relating to the protection of the environment, including those relating to emissions to the air, discharges to surface and subsurface waters, safe drinking water, greenhouse gases and the management of hazardous substances, oils and waste materials. Federal, state and local laws and regulations relating to the protection of the environment may require the current or previous owner or operator of real estate to investigate and remediate hazardous or toxic substances or petroleum product releases at or from the property. Under federal law, generators of waste materials, and current and former owners or operators of facilities, can be subject to liability for investigation and remediation costs at locations that have been identified as requiring response actions. Compliance with environmental laws and regulations can require significant expenditures. In addition, we could incur costs to comply with such current or future laws and regulations, the violation of which could lead to substantial fines and penalties.
We may have to pay governmental entities or third parties for property damage and for investigation and remediation costs that they incurred in connection with any contamination at our current and former properties without regard to whether we knew of or caused the presence of the contaminants. Liability under these laws may be strict, joint and several, meaning that we could be liable for the costs of cleaning up environmental contamination regardless of fault or the amount of waste directly attributable to us. Even if more than one person may have been responsible for the contamination, each person covered by these environmental laws may be held responsible for all of the
clean-up
costs incurred. Environmental liabilities could arise and have a material adverse effect on our financial condition and performance. We do not believe, however, that pending environmental regulatory developments in this area will have a material effect on our capital expenditures or otherwise materially adversely affect its operations, operating costs, or competitive position. -21-
We are subject to anti-corruption, anti-bribery, anti-money laundering, financial and economic sanctions and similar laws,
and non-compliance with such
laws can subject us to administrative, civil and criminal fines and penalties, collateral consequences, remedial measures and legal expenses, all of which could materially and adversely affect our business, prospects, financial condition and results of operations and also our reputation. We are subject to anti-corruption, anti-bribery, anti-money laundering, financial and economic sanctions and similar laws and regulations in various jurisdictions in which we conduct or in the future may conduct activities, including the U.S. Foreign Corrupt Practices Act, FCPA, the U.K. Bribery Act 2010, and other anti-corruption laws and regulations. The FCPA and the U.K. Bribery Act 2010 prohibit us and our officers, directors, employees and business partners acting on our behalf, including agents, from corruptly offering, promising, authorizing or providing anything of value to a “foreign official” for the purposes of influencing official decisions or obtaining or retaining business or otherwise obtaining favorable treatment. The FCPA also requires companies to make and keep books, records and accounts that accurately reflect transactions and dispositions of assets and to maintain a system of adequate internal accounting controls. The U.K. Bribery Act also prohibits
non-governmental
“commercial” bribery and soliciting or accepting bribes. A violation of these laws or regulations could materially and adversely affect our business, financial condition and results of operations and also our reputation. Our policies and procedures designed to ensure compliance with these regulations may not be sufficient and our directors, officers, employees, representatives, consultants, agents, and business partners could engage in improper conduct for which we may be held responsible. Non-compliance with
anti-corruption, anti-bribery, anti-money laundering or financial and economic sanctions laws could subject us to whistleblower complaints, adverse media coverage, investigations, and severe administrative, civil and criminal sanctions, collateral consequences, remedial measures and legal expenses, all of which could materially and adversely affect our business, prospects, financial condition and results of operations and also our reputation. In addition, changes in economic sanctions laws in the future could adversely impact our business and investments in Aurora common stock. Our business may be adversely affected if our lidar technology fails to comply with the regulatory requirements under the Federal Food, Drug, and Cosmetic ACT or otherwise by the FDA.
Our lidar technology is subject to the Electronic Product Radiation Control Provisions of the Federal Food, Drug, and Cosmetic Act, as electronic product radiation includes laser technology. Regulations governing these products are intended to protect the public from hazardous or unnecessary exposure and are enforced by the FDA. Manufacturers are required to certify in product labeling and reports to the FDA that their products comply with applicable performance standards as well as maintain manufacturing, testing, and distribution records for their products. Failure to comply with these requirements could result in enforcement action by the FDA, which could require us to cease distribution of our products, recall or remediate products already distributed to partners
or end-customers,
or subject us to FDA enforcement. We may be subject to product liability that could result in significant direct or indirect costs, which could materially and adversely affect our business, financial condition and results of operations.
Our self-driving technology presents the risk of significant injury, including fatalities. We may be subject to claims if our technology is involved in an accident and persons are injured or purport to be injured. The occurrence of any errors or defects in our products could make us liable for damages and legal claims. In addition, we could incur significant costs to correct such issues, potentially including product recalls. Any negative publicity related to the perceived quality of our technology could affect our brand image, partner
and end-customer demand,
and could materially and adversely affect our business, financial condition and results of operations. Also, liability claims may result in litigation, including class actions, the occurrence of which could be costly, lengthy and distracting and could materially and adversely affect our business, financial condition and results of operations. -22-
Any product recall of ours or our partners in the future may result in adverse publicity, damage our brand and could materially and adversely affect our business, financial condition and results of operations. In the future, we may voluntarily or involuntarily initiate a recall if any vehicles powered by our self-driving technology prove to be defective
or non-compliant with
applicable federal motor vehicle safety standards. Such recalls involve significant expense and diversion of management attention and other resources, which could materially and adversely affect our brand image in our target markets, as well as our business, prospects, financial condition and results of operations. Once we commercialize our technology, we may be required to obtain specialized insurance, which may not be available to the capacity or on the terms that we require to achieve the economics we expect. Further, any insurance that we carry may not be sufficient or it may not apply to all situations. Similarly, our partners could be subjected to claims as a result of such accidents and bring legal claims against us to attempt to hold us liable. Any of these events could materially and adversely affect our brand, relationships with partners, business, financial condition or results of operations.
Risks Related to Our Intellectual Property
Despite the actions we are taking to defend and protect our intellectual property, we may not be able to adequately protect or enforce our intellectual property rights or prevent unauthorized parties from copying or reverse engineering our solutions. Our efforts to protect and enforce our intellectual property rights and prevent third parties from violating our rights may be costly.
The success of our products and our business depends in part on our ability to obtain patents and other intellectual property rights and maintain adequate legal protection for our products in the United States and other international jurisdictions. We rely on a combination of patent, service mark, trademark and trade secret laws, as well as confidentiality procedures and contractual restrictions, to establish and protect our proprietary rights, all of which provide only limited protection.
We cannot assure you that any patents will be issued with respect to our currently pending patent applications or that any trademarks will be registered with respect to our currently pending applications in a manner that gives us adequate defensive protection or competitive advantages, if at all, or that any patents issued to us or any trademarks registered by us will not be challenged, invalidated or circumvented. We have filed for patents and trademarks in the United States and in certain international jurisdictions, but such protections may not be available in all countries in which we operate or in which we seek to enforce our intellectual property rights, or may be difficult to enforce in practice. Our currently-issued
and applied-for
patent and trademark registrations and applications, and any future patents and trademarks that may be issued, registered or applied for, as applicable, may not provide sufficiently broad protection or may not prove to be enforceable in actions against alleged infringers. We also cannot be certain that the steps we have taken will prevent unauthorized use of our technology or the reverse engineering of our technology. Moreover, others may independently develop technologies that are competitive to us or infringe our intellectual property. The protection against unauthorized use of our intellectual property, products and other proprietary rights is expensive and difficult, particularly internationally. We believe that our patents are foundational in the area of self-driving technology. Unauthorized parties may attempt to copy or reverse engineer our technology or certain aspects of our solutions that we consider proprietary. Litigation may be necessary in the future to enforce or defend our intellectual property rights, to prevent unauthorized parties from copying or reverse engineering our solutions, to determine the validity and scope of the proprietary rights of others or to block the importation of infringing products into the United States.
Any such litigation, whether initiated by us or a third party, could result in substantial costs and diversion of management resources, either of which could materially and adversely affect our business, financial condition and results of operations. Even if we obtain favorable outcomes in litigation, we may not be able to obtain adequate remedies, especially in the context of unauthorized parties copying or reverse engineering our solutions.
-23-
Further, many of our current and potential competitors have the ability to dedicate substantially greater resources to defending intellectual property infringement claims and to enforcing their intellectual property rights than we have. Attempts to enforce our rights against third parties could also provoke these third parties to assert their own intellectual property or other rights against us or result in a holding that invalidates or narrows the scope of our rights, in whole or in part. Effective patent, trademark, service mark, copyright and trade secret protection may not be available in every country in which our products are available, and competitors based in other countries may sell infringing products in one or more markets. Failure to adequately protect our intellectual property rights could result in our competitors offering similar products, potentially resulting in the loss of some of our competitive advantage and a decrease in our revenue, which could materially and adversely affect our business, prospects, financial condition and results of operations.
Third-party claims that we are infringing intellectual property, whether successful or not, could subject us to costly and time-consuming litigation or expensive licenses, and our business could be adversely affected.
Although we hold key patents related to our products, a number of companies, both within and outside of the self-driving vehicle industry, hold other patents covering aspects of self-driving technology. In addition to these patents, participants in this industry typically also protect their technology, especially embedded software, through copyrights and trade secrets. In recent years, there has been significant litigation globally involving patents and other intellectual property rights. We have received, and in the future may receive, inquiries from other intellectual property holders and may become subject to claims that we infringe their intellectual property rights, particularly as we expand our presence in the market, expand to new use cases and face increasing competition. We are also party to certain agreements that may limit our trademark rights in certain jurisdictions; while we believe these agreements are unlikely to have a significant impact on our business as currently conducted, our ability to use our existing trademarks in new business lines in the future may be limited. In addition, parties may claim that the names and branding of our products infringe their trademark rights in certain countries or territories. Although we intend to vigorously defend our intellectual property rights, if such a claim were to prevail, we may have to change the names and branding of our products in the affected territories and we could incur other costs.
We currently have a number of agreements in effect pursuant to which we have agreed to defend, indemnify and hold harmless our partners, suppliers, and channel partners and other partners from damages and costs which may arise from the infringement by our products of third-party patents or other intellectual property rights. The scope of these indemnity obligations varies, but may, in some instances, include indemnification for damages and expenses, including attorneys’ fees. We do not carry insurance to cover intellectual property infringement claims. A claim that our products infringe a third party’s intellectual property rights, even if untrue, could adversely affect our relationships with our partners, may deter future partners from purchasing our products and could expose us to costly litigation and settlement expenses. Even if we are not a party to any litigation between a partner and a third party relating to infringement by our products, an adverse outcome in any such litigation could make it more difficult for us to defend our products against intellectual property infringement claims in any subsequent litigation in which we are a named party. Any of these results could materially and adversely affect our business, financial condition and results of operations.
Our defense of intellectual property rights claims brought against us or our partners, suppliers and channel partners, with or without merit, could be time-consuming, expensive to litigate or settle, divert management resources and attention and force us to acquire intellectual property rights and licenses, which may involve substantial royalty or other payments and may not be available on acceptable terms or at all. Further, a party making such a claim, if successful, could secure a judgment that requires us to pay substantial damages or obtain an injunction. An adverse determination also could invalidate our intellectual property rights and adversely affect our ability to offer our products to our partners and may require that we procure or develop substitute products that do not infringe, which could require significant effort and expense. Any of these events could materially and adversely affect our business, financial condition and results of operations.
-24-
We may need to defend ourselves against intellectual property infringement claims, which may be time-consuming and could cause us to incur substantial costs.
Companies, organizations or individuals, including our current and future competitors, may hold or obtain patents, trademarks or other proprietary rights that would prevent, limit or interfere with our ability to make, use, develop or sell our products, which could make it more difficult for us to operate our business. From time to time, we may receive inquiries from holders of patents or trademarks inquiring whether we are infringing their proprietary rights and/or seek court declarations that they do not infringe upon our intellectual property rights. Companies holding patents or other intellectual property rights relating to self-driving technology (including sensors, hardware and software for self-driving vehicles) or other related technology may bring suits alleging infringement of such rights or otherwise asserting their rights and seeking licenses. In addition, if we are determined to have infringed upon a third party’s intellectual property rights, we may be required to do one or more of the following:
| • | cease selling, incorporating or using products that incorporate the challenged intellectual property; |
| • | pay substantial damages; |
| • | obtain a license from the holder of the infringed intellectual property right, which license may not be available on reasonable terms or at all; or |
| • | redesign our technology. |
A successful claim of infringement against us and our failure or inability to obtain a license to the infringed technology could materially and adversely affect our business, financial condition and results of operations. In addition, any litigation or claims, whether or not valid, could result in substantial costs and diversion of resources and management’s attention.
We also hold licenses to intellectual property from third parties, including inbound licenses provided in connection with commercial and other arrangements, and we may face claims that our use of this intellectual property infringes the rights of others. In such cases, we may seek indemnification from our licensors under our license contracts with them. However, our rights to indemnification may be unavailable or insufficient to cover our costs and losses, depending on our use of the technology, whether we choose to retain control over conduct of the litigation, and other factors.
We rely on licenses from third parties for intellectual property that is critical to our business, and we would lose the rights to use such intellectual property if those agreements were terminated or not renewed.
We expect that the long-term contracts and commercial arrangements that we have and intend to enter into with partners may include licenses. We rely on these licenses from our partners for certain intellectual property that is or may become critical to our business. Termination of our current or future partner agreements could cause us to have to negotiate new or restated agreements with less favorable terms or cause us to lose our rights under the original agreements.
In the case of a loss of technology used in our systems, we may not be able to continue to manufacture certain components for our product or for our operations or may experience disruption to our manufacturing processes as we test and requalify any potential replacement technology. Even if we retain the licenses, the licenses may not be exclusive with respect to such component design or technologies, which could aid our competitors and have a negative impact on our business.
Our intellectual property applications for registration may not issue or be registered, which may have a material adverse effect on our ability to prevent others from commercially exploiting products similar to ours.
We cannot be certain that we are the first inventor of the subject matter to which we have filed a particular patent application, or if we are the first party to file such a patent application. If another party has filed a patent application to the same subject matter as we have, we may not be entitled to the protection sought by the patent
-25-
application. We also cannot be certain whether the claims included in a patent application will ultimately be allowed in the applicable issued patent. Further, the scope of protection of issued patent claims is often difficult to determine. As a result, we cannot be certain that the patent applications that we file will issue, or that our issued patents will afford protection against competitors with similar technology. In addition, our competitors may design around our issued patents, which could materially and adversely affect our business, financial condition and results of operations.
As our patents may expire and may not be extended, our patent applications may not be granted and our patent rights may be contested, circumvented, invalidated or limited in scope. In particular, we may not be able to prevent others from developing or exploiting competing technologies, which could materially and adversely affect our business, prospects, financial condition and results of operations.
We cannot assure you that we will be granted patents pursuant to our pending applications. Even if our patent applications succeed and we are issued patents in accordance with them, these patents may still be contested, circumvented or invalidated in the future. In addition, the rights granted under any issued patents may not provide us with meaningful protection or competitive advantages. The claims under any patents that issue from our patent applications may not be broad enough to prevent others from developing technologies that are similar or that achieve results similar to ours. The intellectual property rights of others could also bar us from licensing and exploiting any patents that issue from our pending applications. Numerous patents and pending patent applications owned by others exist in the fields in which we have developed and are developing our technology. These patents and patent applications might have priority over our patent applications and could subject our patent applications to invalidation. Finally, in addition to those who may claim priority, any of our existing or pending patents may also be challenged by others on the basis that they are otherwise invalid or unenforceable.
In addition to patented technology, we rely on our unpatented proprietary technology, trade secrets, processes and
know-how.
We rely on proprietary information (such as trade
secrets, know-how and
confidential information) to protect intellectual property that may not be patentable or subject to copyright, trademark, trade dress or service mark protection, or that we believe is best protected by means that do not require public disclosure. We generally seek to protect this proprietary information by entering into confidentiality agreements, or consulting services or employment agreements that contain non-disclosure and
non-use provisions
with our employees, consultants, contractors and third parties. However, we may fail to enter into the necessary agreements, and even if entered into, these agreements may be breached or may otherwise fail to prevent disclosure, third-party infringement or misappropriation of our proprietary information, may be limited as to their term and may not provide an adequate remedy in the event of unauthorized disclosure or use of proprietary information. Trade secrets or confidential information may also be willfully or unintentionally disclosed, including by employees, who may leave our company and join our competitors. We have limited control over the protection of trade secrets used by our current or future manufacturing partners and suppliers and could lose future trade secret protection if any unauthorized disclosure of such information occurs. In addition, our proprietary information may otherwise become known or be independently developed by our competitors or other third parties. To the extent that our employees, consultants, contractors, advisors and other third parties use intellectual property owned by others in their work for us, disputes may arise as to the rights in related or resulting know-how and
inventions. Costly and time-consuming litigation could be necessary to enforce and determine the scope of our proprietary rights, and failure to obtain or maintain protection for our proprietary information could adversely affect our competitive business position. Furthermore, laws regarding trade secret rights in certain markets where we operate may afford little or no protection to our trade secrets. We also rely on physical and electronic security measures to protect our proprietary information, but we cannot provide assurance that these security measures will not be breached or provide adequate protection for our property or any proprietary information that we hold. There is a risk that third parties may obtain and improperly
-26-
utilize our proprietary information to our competitive disadvantage. We may not be able to detect or prevent the unauthorized use of such information or take appropriate and timely steps to enforce our intellectual property rights.
We may be subject to damages resulting from claims that we or our employees have wrongfully used or disclosed alleged trade secrets of our employees’ former employers.
We may be subject to claims that we or our employees have inadvertently or otherwise used or disclosed trade secrets or other proprietary information of an employee’s former employers. Litigation may be necessary to defend against these claims. If we fail in defending such claims, in addition to paying monetary damages, we may lose valuable intellectual property rights or personnel. A loss of key personnel or their work product could hamper or prevent our ability to commercialize our products, which could severely harm our business. Even if we are successful in defending against these claims, litigation could result in substantial costs and demands on management resources.
Our software contains third-party open-source software components, and failure to comply with the terms of the underlying open-source software licenses could restrict our ability to sell our products or give rise to disclosure obligations of proprietary software.
Our software contains components that are licensed
under so-called “open
source,” “free” or other similar licenses. Open source software is made available to the general public on an “as-is” basis
under the terms of a non-negotiable license.
Certain open source licenses may give rise to obligations to disclose or license our source code or other intellectual property rights if such open source software is integrated with our proprietary software or distributed in certain ways. We currently combine our proprietary software with open source software, but not in a manner that we believe requires the release of the source code of our proprietary software to the public. If we combine or distribute our proprietary software with open source software in a certain manner in the future, we could be required to release the source code to our proprietary software as open source software, or could be required to cease using the relevant open source software which might be costly to replace. Open source licensors also generally do not provide warranties or other contractual protections regarding infringement claims or the quality of the code. In addition, if the license terms for the open source software that we use change, we may be forced to re-engineer our
software, incur additional costs or discontinue the use of certain offerings if re-engineering could
not be accomplished in a timely manner. Although we monitor our use of open source software to avoid subjecting our offerings to unintended conditions, there is a risk that these licenses could be construed in a way that could impose unanticipated conditions or restrictions on our ability to commercialize our offerings. We cannot guarantee that we have incorporated open source software in our software in a manner that will not subject us to liability or in a manner that is consistent with our current policies and procedures. Risks Related to Ownership of Class A Common Stock and Warrants
We will incur significant increased expenses and administrative burdens as a public company, which could materially and adversely affect our business, prospects, financial condition and results of operations.
We face increased legal, accounting, administrative and other costs and expenses as a public company that we did not incur as a private company. The Exchange Act, Sarbanes-Oxley Act, including the requirements of Section 404, as well as rules and regulations subsequently implemented by the SEC, the Dodd-Frank Wall Street Reform and Consumer Protection Act of 2010 and the rules and regulations promulgated and to be promulgated thereunder, the Public Company Accounting Oversight Board and the securities exchanges, impose additional reporting and other obligations on public companies. Compliance with public company requirements will increase costs and make certain activities more time-consuming. A number of those requirements require us to carry out activities we have not done previously. For example, we created new board committees and have adopted new internal controls and disclosure controls and procedures. In addition, expenses associated with SEC reporting requirements will be incurred. Furthermore, if any issues in complying with those requirements are
-27-
identified (for example, if the auditors identify a material weakness or significant deficiency in the internal control over financial reporting), we could incur additional costs rectifying those issues, and the existence of those issues could adversely affect our reputation or investor perceptions of it. In addition, we have obtained director and officer liability insurance. Risks associated with our status as a public company may make it more difficult to attract and retain qualified persons to serve on our Board or as executive officers. The additional reporting and other obligations imposed by these rules and regulations increase legal and financial compliance costs and the costs of related legal, accounting and administrative activities. These increased costs will require us to divert a significant amount of money that could otherwise be used to expand the business and achieve strategic objectives. Advocacy efforts by stockholders and third parties may also prompt additional changes in governance and reporting requirements, which could further increase costs.
Our management has limited experience in operating a public company.
Our executive officers have limited experience in the management of a publicly traded company. Our management team may not successfully or effectively manage our transition to a public company that will be subject to significant regulatory oversight and reporting obligations under federal securities laws. Their limited experience in dealing with the increasingly complex laws pertaining to public companies could be a significant disadvantage in that it is likely that an increasing amount of their time may be devoted to these activities which will result in less time being devoted to the management and growth of the Company. We may not have adequate personnel with the appropriate level of knowledge, experience, and training in the accounting policies, practices or internal controls over financial reporting required of public companies in the United States. The development and implementation of the standards and controls necessary for the Company to achieve the level of accounting standards required of a public company in the United States may require costs greater than expected. It is possible that we will be required to expand our employee base and hire additional employees to support our operations as a public company which will increase our operating costs in future periods.
The terms of the warrants may be amended in a manner adverse to a holder if holders of at least 50% of the then outstanding public warrants approve of such amendment.
The warrants were issued in registered form under the Warrant Agreement, between us and Continental Stock Transfer & Trust Company, as warrant agent. The Warrant Agreement provides that the terms of the warrants may be amended without the consent of any holder to cure any ambiguity or correct any defective provision, but requires the approval by the holders of at least 50% of the then outstanding public warrants to make any change that adversely affects the interests of the registered holders of public warrants. Accordingly, we may amend the terms of the public warrants in a manner adverse to a holder if holders of at least 50% of the then outstanding public warrants approve of such amendment. Although our ability to amend the terms of the public warrants with the consent of at least 50% of the then outstanding public warrants is unlimited, examples of such amendments could be amendments to, among other things, increase the exercise price of the warrants, shorten the exercise period or decrease the number of shares of our common stock purchasable upon exercise of a warrant.
Failure to timely and effectively build our accounting systems to effectively implement controls and procedures required by Section 404(a) of the Sarbanes-Oxley Act could have a material adverse effect on our business.
As a public company, we are required to provide management’s attestation on internal controls. The standards required for a public company under Section 404(a) of the Sarbanes-Oxley Act are significantly more stringent than those required of a private company. Management may not be able to effectively and timely implement controls and procedures that adequately respond to the increased regulatory compliance and reporting requirements. If we are not able to implement the additional requirements of Section 404(a) in a timely manner or with adequate compliance, we may not be able to assess whether our internal controls over financial reporting are effective, which may subject us to adverse regulatory consequences and could harm investor confidence and the market price of our securities.
-28-
To manage the expected growth of our operations and increasing complexity, we will need to improve our operational and financial systems, procedures, and controls and continue to increase systems automation to reduce reliance on manual operations. Any inability to do so will affect our reporting. Our current and planned systems, procedures and controls may not be adequate to support our complex arrangements and the rules governing revenue and expense recognition for our future operations and expected growth. Delays or problems associated with any improvement or expansion of our operational and financial systems and controls could adversely affect our relationships with our partners, cause harm to our reputation and brand and could also result in errors in our financial and other reporting.
We are an emerging growth company within the meaning of the Securities Act, and if we take advantage of certain exemptions from disclosure requirements available to emerging growth companies, this could make our securities less attractive to investors and may make it more difficult to compare our performance with other public companies.
We are an “emerging growth company” within the meaning of the Securities Act, as modified by the JOBS Act, and may take advantage of certain exemptions from various reporting requirements that are applicable to other public companies that are not emerging growth companies for as long as we continue to be an emerging growth company, including, but not limited to, not being required to comply with the auditor attestation requirements of Section 404(b) of the Sarbanes-Oxley Act, reduced disclosure obligations regarding executive compensation in our periodic reports and proxy statements, and exemptions from the requirements of holding a nonbinding advisory vote on executive compensation and shareholder approval of any golden parachute payments not previously approved. As a result, our shareholders may not have access to certain information they may deem important. We will remain an emerging growth company until the earliest of (i) the day we are deemed to be a large accelerated filer, which, in addition to certain other criteria, means the market value of our common equity that is held
by non-affiliates exceeds
$700 million as of the end of the prior fiscal year’s second fiscal quarter, (ii) the last day of the fiscal year in which we have total annual gross revenue of $1.07 billion or more during such fiscal year, (iii) the date on which we have issued more than $1 billion in non-convertible debt
in the prior three-year period and (iv) December 31, 2026. Investors may find our securities less attractive because we will rely on these exemptions. If some investors find our securities less attractive as a result of our reliance on these exemptions, the trading prices of our securities may be lower than they otherwise would be, there may be a less active trading market for our securities and the trading prices of our securities may be more volatile. In addition, Section 107 of the JOBS Act also provides that an emerging growth company can take advantage of the exemption from complying with new or revised accounting standards provided in Section 7(a)(2)(B) of the Securities Act as long as we are an emerging growth company. An emerging growth company can therefore delay the adoption of certain accounting standards until those standards would otherwise apply to private companies. We have elected not to opt out of such an extended transition period and, therefore, we may not be subject to the same new or revised accounting standards as other public companies that are not emerging growth companies. This may make comparison of our financial statements with another public company which is neither an emerging growth company nor an emerging growth company which has opted out of using the extended transition period difficult or impossible because of the potential differences in accounting standards used.
Our Bylaw designate a state or federal court located within the State of Delaware and the federal district courts of the United States as the exclusive forum for substantially all disputes between us and our stockholders, which could limit our stockholders’ ability to choose the judicial forum for disputes with us or our directors, officers or employees.
Our Bylaws provide that unless we consent in writing to the selection of an alternative forum, to the fullest extent permitted by law, the sole and exclusive forum for (i) any derivative action or proceeding brought on our behalf, (ii) any action asserting a claim of breach of a fiduciary duty owed by any of our directors, officers or other employees to us or our stockholders, (iii) any action arising pursuant to any provision of the Delaware
-29-
General Corporation Law, our amended and restated certificate of incorporation or our amended and restated bylaws, or (iv) any other action asserting a claim that is governed by the internal affairs doctrine shall be the Court of Chancery of the State of Delaware (or, if the Court of Chancery does not have jurisdiction, the federal district court for the District of Delaware), in all cases subject to the court having jurisdiction over indispensable parties named as defendants. Our amended and restated bylaws further provide that the federal district courts of the United States will be the exclusive forum for resolving any complaints asserting a cause of action arising under the Securities Act of 1933, as amended, or the Securities Act.
Any person or entity purchasing or otherwise acquiring any interest in any of our securities shall be deemed to have notice of and consented to this provision. This exclusive forum provision may limit a stockholder’s ability to bring a claim in a judicial forum of its choosing for disputes with us or our directors, officers or other employees, which may discourage lawsuits against us and our directors, officers and other employees. This exclusive forum provision will not apply to any causes of action arising under the Securities Act or the Exchange Act or any other claim for which the federal courts have exclusive jurisdiction. Further, the enforceability of similar choice of forum provisions in other companies’ charter documents has been challenged in legal proceedings, and it is possible that a court could find these types of provisions to be inapplicable or unenforceable. For example, the Court of Chancery of the State of Delaware recently determined that a provision stating that U.S. federal district courts are the exclusive forum for resolving any complaint asserting a cause of action arising under the Securities Act is not enforceable. However, this decision may be reviewed and ultimately overturned by the Delaware Supreme Court. If a court were to find either exclusive forum provision in our amended and restated bylaws to be inapplicable or unenforceable in an action, we may incur additional costs associated with resolving the dispute in other jurisdictions, which could harm our results of operations.
Certificate of Incorporation documents and Delaware law could prevent a takeover that stockholders consider favorable and could also reduce the market price of our stock.
Our Certificate of Incorporation and Bylaws contain provisions that could delay or prevent a change in control of the Company. These provisions could also make it more difficult for stockholders to elect directors and take other corporate actions. These provisions include:
| • | authorizing our Board of Directors to issue preferred stock with voting or other rights or preferences that could discourage a takeover attempt or delay changes in control; |
| • | certain of our shareholders, including our Founders, hold sufficient voting power to control voting for election of directors and amend our Certificate of Incorporation; |
| • | prohibiting cumulative voting in the election of directors; |
| • | providing that vacancies on our Board of Directors may be filled only by a majority of directors then in office, even though less than a quorum; |
| • | limiting the liability of, and the indemnification of, our directors and officers; |
| • | prohibiting the adoption, amendment or repeal of our Bylaws or the repeal of the provisions of our Certificate of Incorporation regarding the election and removal of directors without the required approval of at least two-thirds of the shares entitled to vote at an election of directors; |
| • | enabling our Board of Directors to amend the bylaws, which may allow our Board of Directors to take additional actions to prevent an unsolicited takeover and inhibit the ability of an acquirer to amend the bylaws to facilitate an unsolicited takeover attempt; and |
| • | prohibiting stockholder action by written consent; |
| • | limiting the persons who may call special meetings of stockholders; and |
| • | requiring advance notification of stockholder nominations and proposals, which could preclude Stockholders from bringing matters before annual or special meetings of stockholders and delay |
-30-
| changes in our Board of Directors and also may discourage or deter a potential acquirer from conducting a solicitation of proxies to elect their own slate of directors or otherwise attempting to obtain control of us. |
These provisions may frustrate or prevent any attempts by our stockholders to replace or remove our current management by making it more difficult for stockholders to replace members of our Board of Directors, which is responsible for appointing the members of our management. In addition, the provisions of Section 203 of the DGCL govern Aurora. These provisions may prohibit large stockholders, in particular those owning 15% or more of our outstanding voting stock, from merging or combining with Aurora for a certain period of time without the consent of its Board of Directors.
These and other provisions in our Certificate of Incorporation and Bylaws and under Delaware law could discourage potential takeover attempts, reduce the price investors might be willing to pay in the future for shares of our common stock and result in the market price of our common stock being lower than it would be without these provisions.
Claims for indemnification by our directors and officers may reduce our available funds to satisfy successful third-party claims against us and may reduce the amount of money available to us.
Our Certificate of Incorporation and Bylaws provide that we will indemnify our directors and officers, in each case to the fullest extent permitted by Delaware law. In addition, as permitted by Section 145 of the DGCL, our Bylaws and our indemnification agreements that we entered into with our directors and officers provide that:
| • | We will indemnify our directors and officers for serving in those capacities or for serving other business enterprises at our request, to the fullest extent permitted by Delaware law. Delaware law provides that a corporation may indemnify such person if such person acted in good faith and in a manner such person reasonably believed to be in or not opposed to the best interests of the registrant and, with respect to any criminal proceeding, had no reasonable cause to believe such person’s conduct was unlawful; |
| • | We may, in our discretion, indemnify employees and agents in those circumstances where indemnification is permitted by applicable law; |
| • | We are required to advance expenses, as incurred, to our directors and officers in connection with defending a proceeding, except that such directors or officers shall undertake to repay such advances if it is ultimately determined that such person is not entitled to indemnification; |
| • | We are not obligated pursuant to our Bylaws to indemnify a person with respect to proceedings initiated by that person against Aurora or our other indemnitees, except with respect to proceedings authorized by our Board of Directors or brought to enforce a right to indemnification; |
| • | the rights conferred in our Bylaws are not exclusive, and we are authorized to enter into indemnification agreements with our directors, officers, employees and agents and to obtain insurance to indemnify such persons; and |
| • | We may not retroactively amend our amended and restated bylaw provisions to reduce our indemnification obligations to directors, officers, employees and agents. |
We do not intend to pay dividends for the foreseeable future.
We have never declared or paid any cash dividends on our capital stock and do not intend to pay any cash dividends in the foreseeable future. We expect to retain future earnings, if any, to fund the development and growth of our business. Any future determination to pay dividends on our capital stock will be at the discretion of our Board. Accordingly, investors must rely on sales of our common stock after price appreciation, which may never occur, as the only way to realize any future gains on their investments.
-31-
We may be subject to securities litigation, which is expensive and could divert management attention.
The market price of our common stock may be volatile and, in the past, companies that have experienced volatility in the market price of their stock have been subject to securities class action litigation. We may be the target of this type of litigation in the future. Securities litigation against us could result in substantial costs and divert management’s attention from other business concerns, which could seriously harm its business.
Future resales of common stock may cause the market price of our securities to drop significantly, even if our business is doing well.
The Sponsor and the Legacy Aurora Stockholders are contractually restricted from selling or transferring any of its shares of common stock (not including the shares of our common stock issued in the PIPE Investment pursuant to the terms of the Subscription Agreements or purchased in the public market) (the
“Lock-up
Shares”) for certain periods of time. Under the Registration Rights Agreement, such lock-up
restrictions applicable to the Lock-up
Parties’ (as defined in the Registration Rights Agreement) Lock-up
Shares (as defined in the Registration Rights Agreement) begin at the Closing and end in tranches of 25% of the Lock-Up
Parties’ Lock-up
Shares at each of (i) the one year anniversary of Closing, (ii) the two-year
anniversary of the Closing, (iii) the three-year anniversary of the Closing and (iv) the four-year anniversary of the Closing. Notwithstanding the foregoing, (i) each of Mr. Urmson, Mr. Anderson and Mr. Bagnell may sell Registrable Securities (as defined in the Registration Rights Agreement) following the initial six months after the Closing up to an amount of $25 million each and (ii) if, after Closing, Aurora completes a transaction that results in a change of control, the Lock-Up
Parties’ Lock-up
Shares are released from restriction immediately prior to such change of control. Under the Sponsor Agreement, the Sponsor’s lock-up
Shares are subject to the same releases as the Lock-Up
Parties’ Lock-up
Shares, except the Sponsor’s Lock-up
Shares do not contain the right to sell Registrable Shares held by Mr. Urmson, Mr. Anderson and Mr. Bagnell, as described in the previous sentence. Under the Bylaws, all shares held by Legacy Aurora Stockholders immediately prior to the closing are subject to a
lock-up
that began at the Closing and will end on the date that is 180 days following the Closing. However, following the expiration of each lockup, the applicable stockholders will not be restricted from selling shares of Aurora’s common stock held by them, other than by applicable securities laws. Additionally, the Third Party PIPE Investors are not restricted from selling any of their shares of Aurora common stock, other than by applicable securities laws. As such, sales of a substantial number of shares of our common stock in the public market could occur at any time. These sales, or the perception in the market that the holders of a large number of shares intend to sell shares, could reduce the market price of our stock. As restrictions on resale end and registration statements are available for use, the sale or possibility of sale of these shares could have the effect of increasing the volatility in our share price or the market price of our stock could decline if the holders of currently restricted shares sell them or are perceived by the market as intending to sell them.
The market price and trading volume of our common stock may be volatile and could decline significantly.
The stock markets, including Nasdaq on which we list our shares of our stock, have from time to time experienced significant price and volume fluctuations. Even if an active, liquid and orderly trading market develops and is sustained for our stock, the market price of our stock may be volatile and could decline significantly. In addition, the trading volume in our stock may fluctuate and cause significant price variations to occur. If the market price of our stock declines significantly, you may be unable to resell your shares at an attractive price (or at all). We cannot assure you that the market price of our stock will not fluctuate widely or decline significantly in the future in response to a number of factors, including, among others, the following:
| • | the realization of any of the risk factors presented in this prospectus; |
| • | changes in the industries in which we and our customers operate; |
-32-
| • | developments involving our competitors; |
| • | changes in laws and regulations affecting its business; |
| • | actual or anticipated differences in our estimates, or in the estimates of analysts, for our revenues, Adjusted EBITDA, results of operations, level of indebtedness, liquidity or financial condition; |
| • | additions and departures of key personnel; |
| • | failure to comply with the requirements of Nasdaq; |
| • | failure to comply with the Sarbanes-Oxley Act or other laws or regulations; |
| • | future issuances, sales, resales or repurchases or anticipated issuances, sales, resales or repurchases, of our securities; |
| • | publication of research reports by securities analysts about us or our competitors or our industry; |
| • | the public’s reaction to our press releases, its other public announcements and its filings with the SEC; |
| • | actions by stockholders, including the sale by the Third Party PIPE Investors of any of their shares of our stock; |
| • | the performance and market valuations of other similar companies; |
| • | commencement of, or involvement in, litigation involving us; |
| • | broad disruptions in the financial markets, including sudden disruptions in the credit markets; |
| • | speculation in the press or investment community; |
| • | actual, potential or perceived control, accounting or reporting problems; |
| • | changes in accounting principles, policies and guidelines; and |
| • | other events or factors, including those resulting from infectious diseases, health epidemics and pandemics (including the ongoing COVID-19 public health emergency), natural disasters, war, acts of terrorism or responses to these events. |
| • | actual or anticipated fluctuations in our quarterly financial results or the quarterly financial results of companies perceived to be similar to us; |
| • | changes in the market’s expectations about our results of operations; |
| • | our results of operations failing to meet the expectation of securities analysts or investors in a particular period; |
| • | any major change in our Board or management; |
| • | sales of substantial amounts of the shares of common stock by our directors, executive officers or significant stockholders or the perception that such sales could occur; and |
| • | general economic and political conditions such as recessions, interest rates, fuel prices, international currency fluctuations and acts of war or terrorism. |
In the past, securities class-action litigation has often been instituted against companies following periods of volatility in the market price of their shares. This type of litigation could result in substantial costs and divert our management’s attention and resources, which could have a material adverse effect on us.
Broad market and industry factors may materially harm the market price of our securities irrespective of our operating performance. The stock market in general, and Nasdaq in particular, have experienced price and volume fluctuations that have often been unrelated or disproportionate to the operating performance of the particular companies affected. The trading prices and valuations of these stocks, and of our securities, may not be predictable. A loss of investor confidence in the market for retail stocks or the stocks of other companies which
-33-
investors perceive to be similar to the Company could materially and adversely affect our business, prospects, financial condition and results of operations. A decline in the market price of our securities also could adversely affect our ability to issue additional securities and our ability to obtain additional financing in the future.
The dual class structure of our common stock has the effect of concentrating voting control with our Founders. This will limit or preclude your ability to influence corporate matters, including the outcome of important transactions, including a change in control.
Our Class B Common Stock has 10 votes per share, and Class A Common Stock, has one vote per share. The Aurora Founders together own no shares of the Class A Common Stock and 245,765,696 shares of the Class B Common Stock, representing 44.1% of the voting control of the Company. Therefore, the Aurora Founders, individually or together, are able to significantly influence matters submitted to our stockholders for approval, including the election of directors, amendments of our organizational documents and any merger, consolidation, sale of all or substantially all of our assets or other major corporate transactions. The Aurora Founders, individually or together, may have interests that differ from yours and may vote in a way with which you disagree and which may be adverse to your interests. This concentrated control may have the effect of delaying, preventing or deterring a change in control of our company, could deprive our stockholders of an opportunity to receive a premium for their capital stock as part of a sale of our company and might ultimately affect the market price of our stock.
Future transfers by the holders of Class B Common Stock will generally result in those shares converting into shares of Class A Common Stock, subject to limited exceptions, such as certain transfers effected for estate planning or charitable purposes. In addition, each share of Class B Common Stock will convert automatically into one share of Class A Common Stock upon (i) the date specified by affirmative written election of the holders .”
of two-thirds
of the then-outstanding shares of Class B Common Stock, (ii) the date set by our board of directors that is no less than 61 days and no more than 180 days following the date on which the shares of Class B Common Stock held by the Aurora Founders and their permitted entities and permitted transferees represent less than 20% of the Class B Common Stock held by the Aurora Founders and their permitted entities as of immediately following the closing of the Business Combination or (iii) nine months after the death or total disability of the last to die or become disabled of the Aurora Founders, or such later date not to exceed a total period of 18 months after such death or disability as may be approved by a majority of our independent directors. For information about our dual class structure, see the section titled “Description of Capital Stock
Our actual financial position and results of operations may differ materially from the unaudited pro forma condensed combined financial information included in this prospectus.
The unaudited pro forma condensed combined financial information included in this prospectus is presented for illustrative purposes only and is not necessarily indicative of what our actual financial position or results of operations are, nor is it indicative of our future financial position or results of operations. The unaudited pro forma adjustments represent our management’s estimates based on information available and are subject to change as additional information becomes available and analyses are performed. See “” for more information.
Unaudited Pro Forma Condensed Combined Financial Information
We cannot predict the impact our dual class structure may have on our stock price.
We cannot predict whether our dual class structure will result in a lower or more volatile market price of our Class A Common Stock or in adverse publicity or other adverse consequences. For example, certain index providers have announced restrictions on including companies with multiple-class share structures in certain of their indexes. In July 2017, FTSE Russell and S&P Dow Jones announced that they would cease to allow most newly public companies utilizing dual or multi-class capital structures to be included in their indices. Affected indices include the Russell 2000 and the S&P 500, S&P MidCap 400 and S&P SmallCap 600, which together make up the S&P Composite 1500. Beginning in 2017, MSCI, a leading stock index provider, opened public
-34-
consultations on their treatment
of no-vote
and multi-class structures and temporarily barred new multi-class listings from certain of its indices; however, in October 2018, MSCI announced its decision to include equity securities “with unequal voting structures” in its indices and to launch a new index that specifically includes voting rights in its eligibility criteria. Under the announced policies, our dual class capital structure would make us ineligible for inclusion in certain indices, and as a result, mutual funds, exchange-traded funds and other investment vehicles that attempt to passively track those indices will not be investing in our stock. These policies are still fairly new and it is as of yet unclear what effect, if any, they will have on the valuations of publicly traded companies excluded from the indices, but it is possible that they may depress these valuations compared to those of other similar companies that are included. Because of our dual class structure, we will likely be excluded from certain of these indexes and we cannot assure you that other stock indexes will not take similar actions. Given the sustained flow of investment funds into passive strategies that seek to track certain indexes, exclusion from stock indexes would likely preclude investment by many of these funds and could make our stock less attractive to other investors. As a result, the market price of our stock could be adversely affected. The exercise of warrants for our stock would increase the number of shares eligible for future resale in the public market and result in dilution to our stockholders. Such dilution will increase if more of our shares are redeemed.
As of November 3, 2021, we had warrants to purchase an aggregate of 21,118,750 shares of our stock outstanding, comprising 12,218,750 public warrants and 8,900,000 Private Placement Warrants. These warrants will become exercisable at any time commencing on December 3, 2021. The likelihood that those warrants will be exercised increases if the trading price of shares of our stock exceeds the exercise price of the warrants. The exercise price of these warrants is $11.50 per share.
There is no guarantee that the warrants will ever be in the money after they become exercisable and prior to their expiration, and as such, the warrants may expire worthless.
To the extent the warrants are exercised, additional shares of our stock will be issued, which will result in dilution to the holders of our stock and increase the number of shares eligible for resale in the public market. Holders of warrants do not have a right to redeem the warrants. Sales of substantial numbers of shares issued upon the exercise of warrants in the public market or the potential that such warrants may be exercised could also adversely affect the market price of our stock.
We may redeem your unexpired warrants prior to their exercise at a time that is disadvantageous to you, thereby making your warrants worthless.
We will have the ability to redeem the outstanding public warrants at any time after they become exercisable and prior to their expiration, at a price of $0.01 per warrant, if, and only if, the last reported sales price of our common stock equals or exceeds $18.00 per share (as adjusted for adjustments to the number of shares issuable upon exercise or the exercise price of a warrant) for any 20 trading days within a 30
trading-day
period ending on the third trading day prior to the date we send the notice of redemption to the warrant holders (the “Reference Value”). If and when the warrants become redeemable by us, we may exercise our redemption right even if we are unable to register or qualify the underlying securities for sale under all applicable state securities laws. Redemption of the outstanding warrants as described above could force you to: (1) exercise your warrants and pay the exercise price therefor at a time when it may be disadvantageous for you to do so; (2) sell your warrants at the then-current market price when you might otherwise wish to hold your warrants; or (3) accept the nominal redemption price which, at the time the outstanding warrants are called for redemption, we expect would be substantially less than the market value of your warrants. None of the Private Placement Warrants will be redeemable by us in such a case so long as they are held by the Sponsor or its permitted transferees, but the Sponsor has agreed to exercise all of its Private Placement Warrants for cash or on a “cashless basis” on or prior to the redemption date, in the event that the Reference Value exceeds $18.00 per -35-
share (as adjusted for adjustments to the number of shares issuable upon exercise or the exercise price of a warrant) and we elect to redeem the public warrants pursuant to the Warrant Agreement and notify the Sponsor of such election and the redemption date on or prior to the date we mail a notice of redemption to the holders of the public warrants.
In addition, we will have the ability to redeem the outstanding warrants (including the Private Placement Warrants if the Reference Value is less than $18.00 per share) for shares of our stock at any time after they become exercisable and prior to their expiration, at a price of $0.10 per warrant if, among other things, the Reference Value equals or exceeds $10.00 per share (as adjusted for adjustments to the number of shares issuable upon exercise or the exercise price of a warrant). In such a case, the holders will be able to exercise their warrants prior to redemption for a number of shares of our common stock determined based on the redemption date and the fair market value of our common stock, as set forth in Section 6.2 of the Warrant Agreement attached as Exhibit 4.3 to the Registration Statement. The value received upon exercise of the warrants (1) may be less than the value the holders would have received if they had exercised their warrants at a later time where the underlying share price is higher and (2) may not compensate the holders for the value of the warrants, including because the number of shares of common stock received is capped at 0.361 shares of our stock per warrant (subject to adjustment) irrespective of the remaining life of the warrants.
In the event we elect to redeem the warrants that are subject to redemption, we will mail the notice of redemption by first class mail, postage prepaid, not less than thirty days prior to the redemption date to the registered holders of the warrants to be redeemed at their last addresses as they appear on the registration books. Any notice mailed in such manner will be conclusively presumed to have been duly given whether or not the registered holder received such notice and we are not required to provide any notice to the beneficial owners of such warrants. Additionally, while we are required to provide such notice of redemption, we are not separately required to, and do not currently intend to, notify any holders of when the warrants become eligible for redemption. If you do not exercise your warrants in connection with a redemption, including because you are unaware that such warrants are being redeemed, you would only receive the nominal redemption price for your warrants.
If securities or industry analysts do not publish or cease publishing research or reports about us, our business, or the market in which we operate, or if they change their recommendations regarding our securities adversely, the price and trading volume of our securities could decline.
The trading market for our securities will be influenced by the research and reports that industry or securities analysts may publish about us, our business, market or competitors. If any of the analysts who may cover us change their recommendation regarding our shares of common stock adversely, or provide more favorable relative recommendations about our competitors, the price of our common stock would likely decline. If any analyst who may cover us were to cease our coverage of us or fail to regularly publish reports on it, we could lose visibility in the financial markets, which in turn could cause our share price or trading volume to decline.
Future issuances of debt securities and equity securities may adversely affect us, including the market price of our stock and may be dilutive to existing stockholders.
In the future, we may incur debt or issue equity ranking senior to our Class A Common Stock. Those securities will generally have priority upon liquidation. Such securities also may be governed by an indenture or other instrument containing covenants restricting its operating flexibility. Additionally, any convertible or exchangeable securities that we issue in the future may have rights, preferences and privileges more favorable than those of our Class A Common Stock. Because our decision to issue debt or equity in the future will depend on market conditions and other factors beyond our control, we cannot predict or estimate the amount, timing, nature or success of our future capital raising efforts. As a result, future capital raising efforts may reduce the market price of our stock and be dilutive to existing stockholders.
-36-
Our failure to meet the continued listing requirements of Nasdaq could result in a delisting of our securities.
If we fail to satisfy the continued listing requirements of Nasdaq such as the corporate governance requirements or the minimum closing bid price requirement, Nasdaq may take steps to delist our securities. Such a delisting would likely have a negative effect on the price of the securities and would impair your ability to sell or purchase the securities when you wish to do so. In the event of a delisting, we can provide no assurance that any action taken by us to restore compliance with listing requirements would allow our securities to become listed again, stabilize the market price or improve the liquidity of our securities, prevent our securities from dropping below the Nasdaq minimum bid price requirement or prevent
future non-compliance
with Nasdaq’s listing requirements. Additionally, if our securities are not listed on, or become delisted from, Nasdaq for any reason, and are quoted on the OTC Bulletin Board, an inter-dealer automated quotation system for equity securities that is not a national securities exchange, the liquidity and price of our securities may be more limited than if we were quoted or listed on Nasdaq or another national securities exchange. You may be unable to sell your securities unless a market can be established or sustained. -37-
USE OF PROCEEDS
All of the Securities offered by the Selling Securityholders pursuant to this prospectus will be sold by the Selling Securityholders for their respective accounts. We will not receive any of the proceeds from the sale of the Securities hereunder.
With respect to the registration of all shares of Class A Common Stock and Private Placement Warrants offered by the Selling Securityholders pursuant to this prospectus, the Selling Securityholders will pay any underwriting discounts and commissions and expenses incurred by them for brokerage, accounting, tax or legal services or any other expenses incurred by them in disposing of the Securities. We will bear the costs, fees and expenses incurred in effecting the registration of the securities covered by this prospectus, including all registration and filing fees and fees and expenses of our counsel and our independent registered public accounting firm.
We will receive up to an aggregate of approximately $244.1 million from the exercise of the Warrants assuming the exercise in full of all of the Warrants for cash and from the exercise of Former Employee Options. We expect to use the net proceeds from the exercise of the Warrants and Former Employee Options for general corporate purposes. There is no assurance that the holders of the Warrants will elect to exercise any or all of such Warrants or that they will exercise any or all of them for cash. The amount of cash we would receive from the exercise of Warrants will decrease to the extent that Warrants are exercised on a cashless basis.
-38-
MARKET PRICE OF THE REGISTRANT’S COMMON EQUITY AND
RELATED STOCKHOLDER MATTERS
Market Information and Holders
The Class A Common Stock and Warrants trade on Nasdaq under the trading symbols “AUR” and “AUROW,” respectively.
As of November 3, 2021, the Company had approximately 642,869,548 shares of Class A Common Stock issued and outstanding held of record by 178 holders and approximately 21,118,750 Warrants issued and outstanding, each exercisable for one share of Class A Common Stock at a price of $11.50 per share, held of record by 2 holders.
Dividend Policy
We have not paid any cash dividends on the Class A Common Stock to date. We may retain future earnings, if any, for future operations, expansion and debt repayment and has no current plans to pay cash dividends for the foreseeable future. Any decision to declare and pay dividends in the future will be made at the discretion of the Board and will depend on, among other things, our results of operations, financial condition, cash requirements, contractual restrictions and other factors that the Board may deem relevant. In addition, our ability to pay dividends may be limited by covenants of any future outstanding indebtedness the Company or its subsidiaries incur. We do not anticipate declaring any cash dividends to holders of the Class A Common Stock in the foreseeable future.
-39-
UNAUDITED PRO FORMA CONDENSED COMBINED FINANCIAL INFORMATION
Unless otherwise indicated or the context otherwise requires, references to: (a) ”Aurora Innovation, Inc.” or “Aurora” refers to RTPY and its consolidated subsidiaries after giving effect to the Business Combination, (b) ”Legacy Aurora” refers to Aurora Innovation, Inc., a Delaware corporation, prior to the Closing and (c) ”RTPY” refers to Reinvent Technology Partners Y, a Cayman corporation, prior to the Closing. Capitalized terms used but not defined in this section shall have the meanings ascribed to them in this prospectus.
We are providing the following unaudited pro forma condensed combined financial information to aid in the analysis of the financial aspects of the Merger. The Merger and the related transactions, as further described elsewhere in the unaudited pro forma financial information, were completed on November 3, 2021.
The following unaudited pro forma condensed combined financial information presents the combination of the financial information of RTPY and Legacy Aurora, adjusted to give effect to the Merger and other events contemplated by the Business Combination Agreement. The following unaudited pro forma condensed combined financial information has been prepared in accordance with Article 11 of
Regulation S-X
as amended by the final rule, Release 33-10786
“Amendments to Financial Disclosures about Acquired and Disposed Businesses.” The unaudited pro forma condensed combined balance sheet of RTPY as of June 30, 2021 combines the historical balance sheet of RTPY as of June 30, 2021 and the historical consolidated balance sheet of Aurora as of June 30, 2021, adjusted to give pro forma effect to the Business Combination between RTPY and Aurora, summarized below, the PIPE Investment and certain other related events related to the Business Combination, in each case, as if the Business Combination, PIPE Investment and the other related events had been consummated on June 30, 2021.
The unaudited pro forma combined statements of operations for the year ended December 31, 2020 and for the six months ended June 30, 2021 combine the historical statements of operations of RTPY and the historical consolidated statements of operations of Aurora for such periods on a pro forma basis as if the Business Combination and related transactions had been consummated on January 1, 2020, the beginning of the earliest period presented.
Additionally, and as further described in Note 2 to the unaudited pro forma condensed combined financial information herein, Aurora completed the acquisition of Apparate on January 19, 2021. The acquisition of Apparate was deemed to be a material transaction that is separate from the Business Combination. The unaudited pro forma combined statements of operations for the year ended December 31, 2020 and for the six months ended June 30, 2021 combine the historical statements of operations of Aurora and Apparate as if the acquisition of Apparate had occurred on January 1, 2020, the beginning of the earliest period presented. The acquisition of Apparate is reflected in the balance sheet of Aurora as of June 30, 2021.
The unaudited pro forma condensed combined financial information was derived from and should be read in conjunction with the following historical financial statements and the accompanying notes, which are included elsewhere in this prospectus:
| • | the (a) historical audited financial statements of RTPY as of December 31, 2020 and for the period from October 2, 2020 (inception) through December 31, 2020 and (b) historical unaudited condensed financial statements of RTPY as of and for the six months ended June 30, 2021; |
| • | the (a) historical audited financial statements of Aurora as of and for the year ended December 31, 2020 and (b) historical unaudited condensed consolidated financial statements of Aurora as of and for the six months ended June 30, 2021; |
| • | the historical audited consolidated financial statements of Apparate, as of and for the year-ended December 31, 2020, included elsewhere in this prospectus; and |
| • | other information relating to RTPY and Aurora included in this prospectus. |
-40-
The unaudited pro forma condensed combined financial information should be read together with the section titled “” and other financial information included elsewhere in this prospectus.
Management’s Discussion and Analysis of Financial Condition and Results of Operations
The unaudited pro forma combined financial statements do not necessarily reflect what the Company’s financial condition or results of operations would have been had the Business Combination occurred on the dates indicated. The unaudited pro forma combined financial information also may not be useful in predicting the future financial condition and results of operations of the Company. The actual financial position and results of operations may differ significantly from the pro forma amounts reflected herein due to a variety of factors.
Description of the Business Combination and the related transactions
The Domestication, Merger, PIPE Investment and accompanying transactions may be summarized as follows:
| • | RTPY changed its jurisdiction of incorporation from the Cayman Islands to the State of Delaware; |
| • | RTPY entered into the Merger Agreement with Merger Sub and Legacy Aurora, pursuant to which, among other things, following the Domestication, (i) Merger Sub merged with and into Legacy Aurora, the separate corporate existence of Merger Sub ceased and Legacy Aurora became the surviving corporation and a wholly owned subsidiary of RTPY, and RTPY was renamed Aurora Innovation, Inc.; |
| • | Prior to the effective time of the Merger, Legacy Aurora adopted the A&R Certificate of Incorporation to implement a dual class structure, pursuant to which (i) Legacy Aurora authorized and issued the Aurora Class B Stock and (ii) each existing share of Legacy Aurora Series A Preferred Stock or Legacy Aurora Series B Preferred Stock issued and outstanding as of immediately prior to the Conversion Amendment (as defined below) was provided the right to convert each such share, from and following the Conversion Amendment, into one share of Legacy Aurora Class B Stock ((i) and (ii) together, the “Conversion Amendment”). For the avoidance of doubt, all rights, preferences, privileges and powers of, and restrictions provided for the benefit of the Legacy Aurora Series Seed 1 Preferred Stock, Legacy Aurora Series Seed 2 Preferred Stock, Legacy Aurora Series U-1 Preferred Stock, Legacy Aurora Series U-2 Preferred Stock or Legacy Aurora Series B-1 Preferred Stock remained unchanged by the Conversion Amendment; |
| • | Prior to the effective time of the Merger, but immediately subsequent to the Conversion Amendment, and pursuant to the terms of the A&R Certificate of Incorporation, each share of Legacy Aurora Series Seed 1 Preferred Stock, Legacy Aurora Series Seed 2 Preferred Stock, Legacy Aurora Series U-1 Preferred Stock, Legacy Aurora Series U-2 Preferred Stock or Legacy Aurora Series B-1 Preferred Stock automatically converted into one share of Legacy Aurora common stock (the “Preferred Stock Conversion”); |
| • | Prior to the effective time of the Merger, but immediately subsequent to the Conversion Amendment, and pursuant to certain contractual exchange agreements with Legacy Aurora, each share of Legacy Aurora common stock held by the Aurora Founders was exchanged for one share of Legacy Aurora Class B Stock (the “Exchange” and, together with the Conversion Amendment and the Preferred Stock Conversion, the “Pre-Closing Restructuring”); |
| • | Upon the consummation of the Merger, Legacy Aurora Stockholders received an aggregate of 1,100,000,000 shares of Legacy Aurora common stock (at a deemed value of $10.00 per share), which, in the case of Legacy Aurora Awards, were shares underlying awards based on Legacy Class A Common Stock, representing a pre-transaction equity value of Aurora of $11.0 billion (such total number of shares of Legacy Aurora common stock, the “Aggregate Merger Consideration”). Specifically, after giving effect to the Pre-Closing Restructuring, (a) each share of Legacy Aurora common stock was cancelled and converted into the right to receive a number of shares of Class A Common Stock equal to the quotient obtained by dividing (i) the Aggregate Merger Consideration by |
-41-
| (ii) the aggregate fully diluted number of shares of Legacy Aurora capital stock (the “Exchange Ratio”) and (b) each share of Legacy Aurora Class B Stock will be cancelled and converted into the right to receive a number of shares of Class B Common Stock equal to the Exchange Ratio of approximately 2.1708. The portion of the Aggregate Merger Consideration reflecting the conversion of the Legacy Aurora Awards was calculated assuming that all Legacy Aurora Options are net-settled. Holders of Legacy Aurora common stock received Class A Common Stock and holders of Legacy Aurora Class B Stock received Class B Common Stock. Accordingly, 513,575,373 shares of Class A Common Stock and 481,107,977 shares of Class B Common Stock were issued as outstanding shares to Legacy Aurora Stockholders upon completion of the Business Combination; |
| • | 82,432,681 shares have been reserved for the potential future issuance of Class A Common Stock upon the exercise of Aurora Options and 34,698,749 shares have been reserved for the potential future issuance of Class A Common Stock upon the settlement of Aurora RSU Awards based on the following transactions contemplated by the Merger Agreement: |
| • | The conversion of all outstanding Legacy Aurora Options into options exercisable for shares of Class A Common Stock with the same terms except for the number of shares exercisable and the exercise price, each of which will be adjusted using the Exchange Ratio; |
| • | The conversion of all outstanding Legacy Aurora RSU Awards into awards of restricted stock units based on shares of Class A Common Stock with the same terms, except the number of restricted stock units comprising the award will be adjusted using the Exchange Ratio; |
| • | Aurora issued and sold 100,000,000 shares of Class A Common Stock at $10.00 per share to the PIPE Investors pursuant to the PIPE Investment; |
| • | 75,458,911 of Class A ordinary shares were redeemed by RTPY public shareholders in connection with the Business Combination for an aggregate redemption price of approximately $754.6 million; |
| • | 17,434,414 Sponsor Shares were forfeited as a result of the above redemptions; |
| • | 1,720,772 shares of Aurora Class A common stock was issued as a result of conversion of Class B ordinary shares of RTPY owned by the Sponsor in the Domestication and become subject to a lock-up (but not price-based vesting) until the first anniversary following the completion of the Business Combination. Such shares represent 25% of the Remaining Sponsor Shares; |
| • | Additionally, 5,162,314 shares of Aurora Class A common stock issued as a result of the conversion of Class B ordinary shares of RTPY owned by the Sponsor in the Domestication have been immediately subject to both price-based vesting provisions and lock-up provisions. Such shares represent 75% of the Remaining Sponsor Shares; and |
| • | The Sponsor Shares subject to both price-based vesting provisions and a lock-up will consist of three tranches, equaling 1,720,772, 1,720,771 and 1,720,771 shares of Aurora Class A common stock for the first tranche, the second tranche and the third tranche, respectively, as follows: |
| • | Tranche I a 20-trading day volume-weighted average price measurement basis and (ii) a lock up of two years following the completion of the Business Combination. |
| • | Tranche II a 20-trading day volume-weighted average price measurement basis and (ii) a lock up of three years following the completion of the Business Combination. |
| • | Tranche III a 20-trading day volume-weighted average price measurement basis and (ii) a lock up of four years following the completion of the Business Combination. |
-42-
If the price-based vesting conditions have not been met prior to or on the 10
th
anniversary from the completion of the Business Combination, any unvested Sponsor Shares are forfeited. Additionally, upon a change in control event, all of the Sponsor Shares become vested and are released from the lock-up.
Accounting for the Business Combination
The Business Combination is accounted for as a reverse recapitalization in accordance with GAAP. Under this method of accounting, RTPY will be treated as the acquired company for financial reporting purposes. Accordingly, for accounting purposes, the Business Combination will be treated as the equivalent of Aurora issuing shares for the net assets of RTPY, accompanied by a recapitalization.
Aurora has been determined to be the accounting acquirer based on evaluation of the following facts and circumstances:
| • | Legacy Aurora Stockholders have the largest voting interest in the post-combination company; |
| • | Legacy Aurora will have the ability to appoint the majority of the members of the Aurora Board; |
| • | Legacy Aurora will comprise the ongoing operations of Aurora; |
| • | Legacy Aurora management hold executive management roles (including Chief Executive Officer, among others) in the post-combination company and are responsible for the day-to-day operations; |
| • | The post-combination company assumed the Aurora branded name: Aurora Innovation, Inc. |
Accordingly, the net assets of RTPY will be recognized at historical cost (which is expected to be consistent with carrying value), with no goodwill or other intangible assets recorded. Operations prior to the Business Combination will be presented in future financial reports as those of Aurora.
The unvested Sponsor Shares are expected be classified as a liability measured at fair value as at the date of the Business Combination, subject to subsequent remeasurement at each reporting date until the liability is settled in accordance with the vesting terms or the Sponsor Shares are forfeited upon the 10
th
anniversary. Public and private warrants of RTPY are not expected to be modified as a result of the Business Combination, resulting in no accounting impact upon consummation of Business Combination. All outstanding capital stock of Legacy Aurora were converted into shares of common stock of Aurora based on the Exchange Ratio, with the corresponding increase in the par value of common stock being recognized against
additional paid-in capital.
Outstanding vested and unvested share-based awards of Legacy Aurora (including options and RSUs) were converted into the right to receive upon vesting or exercise such awards for common shares of Aurora, adjusted proportionately based on the Exchange Ratio. Because no terms of such share-based awards were modified upon consummation of the Business Combination, no accounting impact for such outstanding awards is expected. For pro forma presentation purposes, the Exchange Ratio is approximately 2.1708. Basis of Pro Forma Presentation
The adjustments in the unaudited pro forma condensed combined financial information have been identified and presented to provide relevant information of Aurora upon consummation of the Business Combination and other events contemplated by the Merger Agreement. Assumptions and estimates underlying the unaudited pro forma adjustments set forth in the unaudited pro forma condensed combined financial information are described in the accompanying notes.
The unaudited pro forma condensed combined financial information has been presented for illustrative purposes only and is not necessarily indicative of the operating results and financial position that would have
-43-
been achieved had the Business Combination occurred on the dates indicated. Any additional Business Combination proceeds remaining after the payment of redeeming RTPY shareholders, the payment of underwriter fees and the payment of transaction costs related to the Merger are expected to be used for other general corporate purposes. Further, the unaudited pro forma condensed combined financial information does not purport to project the future operating results or financial position of Aurora following the completion of the Business Combination. The unaudited pro forma adjustments represent management’s estimates based on information available as of the date of these unaudited pro forma condensed combined financial information and are subject to change as additional information becomes available and analyses are performed. RTPY and Aurora have not had any historical relationship prior to the transactions, accordingly, no pro forma adjustments were required to eliminate activities between the companies.
The following summarizes the pro forma Aurora common stock issued and outstanding immediately after the Business Combination and the related ownership percentages.
(in millions) |
Number of Shares |
Percentage of Outstanding Shares |
||||||
| Legacy Aurora Stockholders (1)
|
1,047.0 | 93.6 | % | |||||
| Sponsor, Sponsor Related PIPE Investor and RTPY independent directors (2)
|
9.3 | 0.8 | % | |||||
| RTPY’s public shareholders (3)
|
22.3 | 2.0 | % | |||||
| Third Party PIPE Investors |
40.2 | 3.6 | % | |||||
| |
|
|
|
|||||
| Outstanding Shares |
1,118.8 | 100.0 | % | |||||
| |
|
|
|
|||||
| (1) | Includes (i) 513.6 million shares of Class A Common Stock (ii) 481.1 million shares of Class B Common Stock, and (iii) 52.4 million shares subscribed for through the PIPE by existing Legacy Aurora investors. Excludes (i) 82.4 million shares underlying the Aurora Options, whether unvested or vested, and (ii) 34.7 million shares underlying Aurora RSU Awards. |
| (2) | Includes 7.5 million shares to be purchased by Sponsor Related PIPE Investor as part of the PIPE Investment. Excludes 5.2 million Sponsor Shares which became subject to price-based vesting conditions in conjunction with the completion of the Business Combination. |
| (3) | The number of shares is net of redemptions of approximately 75.5 million Class A ordinary shares of RTPY at redemption price of approximately $10.00 per share. |
-44-
UNAUDITED PRO FORMA CONDENSED COMBINED BALANCE SHEET
AS OF JUNE 30, 2021
(in thousands)
RTPY (Historical) |
Aurora (Historical) |
Transaction Accounting Adjustments |
Pro Forma Combined |
|||||||||||||||||
| ASSETS |
||||||||||||||||||||
| Current assets: |
||||||||||||||||||||
| Cash and cash equivalents |
$ | 501 | $ | 784,813 | $ | 1,142,893 | A | $ | 1,928,207 | |||||||||||
| Restricted cash, current |
— | 182 | — | 182 | ||||||||||||||||
| Prepaid expenses and other current assets |
1,325 | 23,159 | (3,476 | ) | B | 21,008 | ||||||||||||||
| |
|
|
|
|
|
|
|
|||||||||||||
| Total current assets |
1,826 | 808,154 | 1,139,417 | 1,949,397 | ||||||||||||||||
| Cash held in trust account |
977,544 | — | (977,544 | ) | C | — | ||||||||||||||
| Property and equipment, net |
— | 80,112 | — | 80,112 | ||||||||||||||||
| Operating lease right-of-use assets |
— | 146,593 | — | 146,593 | ||||||||||||||||
| Restricted cash, noncurrent |
— | 13,300 | — | 13,300 | ||||||||||||||||
| Other assets, net |
— | 19,777 | — | 19,777 | ||||||||||||||||
| Acquisition related intangible assets |
— | 617,200 | — | 617,200 | ||||||||||||||||
| Goodwill |
— | 1,111,197 | — | 1,111,197 | ||||||||||||||||
| |
|
|
|
|
|
|
|
|||||||||||||
| Total assets |
$ | 979,370 | $ | 2,796,333 | $ | 161,873 | $ | 3,937,576 | ||||||||||||
| |
|
|
|
|
|
|
|
|||||||||||||
| LIABILITIES AND STOCKHOLDERS’ EQUITY (DEFICIT) |
||||||||||||||||||||
| Current liabilities: |
||||||||||||||||||||
| Accounts payable |
$ | 28 | $ | 6,541 | $ | (25 | ) | D | $ | 6,544 | ||||||||||
| Accrued expenses and other current liabilities |
323 | 53,595 | (3,341 | ) | D | 50,577 | ||||||||||||||
| Operating lease liabilities, current |
— | 10,816 | — | 10,816 | ||||||||||||||||
| Related party payable |
498 | 1,422 | — | 1,920 | ||||||||||||||||
| |
|
|
|
|
|
|
|
|||||||||||||
| Total current liabilities |
849 | 72,374 | (3,366 | ) | 69,857 | |||||||||||||||
| Other liabilities |
— | 434 | — | 434 | ||||||||||||||||
| Derivative warrant liabilities |
38,914 | — | — | 38,914 | ||||||||||||||||
| Deposit liability |
— | 50,000 | — | 50,000 | ||||||||||||||||
| Derivative liability – Sponsor Shares |
— | — | 46,941 | E | 46,941 | |||||||||||||||
| Deferred legal fees and underwriting commissions |
34,231 | — | (34,231 | ) | F | — | ||||||||||||||
| Operating lease liabilities, long-term |
— | 127,715 | — | 127,715 | ||||||||||||||||
| Deferred tax liability |
— | 3,203 | — | 3,203 | ||||||||||||||||
| |
|
|
|
|
|
|
|
|||||||||||||
| Total liabilities |
73,994 | 253,726 | 9,344 | 337,064 | ||||||||||||||||
| |
|
|
|
|
|
|
|
|||||||||||||
| Redeemable convertible preferred stock |
— | 2,161,145 | (2,161,145 | ) | G | — | ||||||||||||||
| Common shares subject to possible redemption |
900,376 | — | (900,376 | ) | H | — | ||||||||||||||
| Stockholders’ equity (deficit): |
||||||||||||||||||||
| RTPY Class A Ordinary Shares |
1 | — | (1 | ) | I | — | ||||||||||||||
| RTPY Class B Ordinary Shares |
2 | — | (2 | ) | I | — | ||||||||||||||
| Class A Common Stock |
— | — | 63 | J | 63 | |||||||||||||||
| Class B Common Stock |
— | — | 48 | K | 48 | |||||||||||||||
| Legacy Aurora common stock |
— | 25 | (25 | ) | L | — | ||||||||||||||
| Additional paid-in capital |
10,845 | 1,087,631 | 3,259,322 | M | 4,357,798 | |||||||||||||||
| Retained earnings (accumulated deficit) |
(5,848 | ) | (706,194 | ) | (45,355 | ) | N | (757,397 | ) | |||||||||||
| |
|
|
|
|
|
|
|
|||||||||||||
| Total stockholders’ equity |
5,000 | 381,462 | 3,214,050 | 3,600,512 | ||||||||||||||||
| |
|
|
|
|
|
|
|
|||||||||||||
| Total liabilities and stockholders’ equity (deficit) |
979,370 | 2,796,333 | 161,873 | 3,937,576 | ||||||||||||||||
| |
|
|
|
|
|
|
|
|||||||||||||
-45-
UNAUDITED PRO FORMA CONDENSED COMBINED STATEMENT OF OPERATIONS
FOR THE YEAR ENDED DECEMBER 31, 2020
(in thousands, except share and per share amounts)
For the Year Ended December 31, 2020 |
Apparate Acquisition |
For the period from October 2, 2020 (inception) to December 31, 2020 RTPY (Historical) |
Transaction Accounting Adjustments |
Pro Forma Combined |
||||||||||||||||||||||||||||||||
Aurora Innovation, Inc. (Historical) |
Apparate (Historical) |
Transaction Accounting Adjustments |
Pro Forma Combined |
|||||||||||||||||||||||||||||||||
| Revenue |
$ | — | $ | 100,000 | $ | (100,000 | ) | O | $ | — | $ | — | $ | — | $ | — | ||||||||||||||||||||
| Operating Expenses |
||||||||||||||||||||||||||||||||||||
| Research and development |
179,426 | 649,047 | 36,409 | P | 864,882 | — | 88,583 | R | 953,465 | |||||||||||||||||||||||||||
| Selling, general and administrative |
38,693 | 150,637 | (3,812 | ) | Q | 185,518 | 19 | 5,903 | S | 191,440 | ||||||||||||||||||||||||||
| |
|
|
|
|
|
|
|
|
|
|
|
|
|
|||||||||||||||||||||||
| Total operating expenses |
218,119 | 799,684 | 32,597 | 1,050,400 | 19 | 94,486 | 1,144,905 | |||||||||||||||||||||||||||||
| |
|
|
|
|
|
|
|
|
|
|
|
|
|
|||||||||||||||||||||||
| Loss from operations |
(218,119 | ) | (699,684 | ) | (132,597 | ) | (1,050,400 | ) | (19 | ) | (94,486 | ) | (1,144,905 | ) | ||||||||||||||||||||||
| |
|
|
|
|
|
|
|
|
|
|
|
|
|
|||||||||||||||||||||||
| Interest and other income, net |
3,672 | 2,409 | — | 6,081 | — | — | 6,081 | |||||||||||||||||||||||||||||
| |
|
|
|
|
|
|
|
|
|
|
|
|
|
|||||||||||||||||||||||
| Loss before income taxes |
$ | (214,447 | ) | $ | (697,275 | ) | $ | (132,597 | ) | $ | (1,044,319 | ) | (19 | ) | (94,486 | ) | $ | (1,138,824 | ) | |||||||||||||||||
| |
|
|
|
|
|
|
|
|
|
|
|
|
|
|||||||||||||||||||||||
| Income taxes (benefit) expense |
2 | (1,510 | ) | — | (1,508 | ) | — | — | (1,508 | ) | ||||||||||||||||||||||||||
| |
|
|
|
|
|
|
|
|
|
|
|
|
|
|||||||||||||||||||||||
| Net income (loss) |
$ | (214,449 | ) | $ | (695,765 | ) | $ | (132,597 | ) | $ | (1,042,811 | ) | $ | (19 | ) | $ | (94,486 | ) | $ | (1,137,316 | ) | |||||||||||||||
| |
|
|
|
|
|
|
|
|
|
|
|
|
|
|||||||||||||||||||||||
| Weighted average shares outstanding, Aurora, basic and diluted |
124,743,865 | |||||||||||||||||||||||||||||||||||
| Net loss per share attributable to Aurora, basis and diluted |
$ | (1.72 | ) | |||||||||||||||||||||||||||||||||
| Weighted average shares outstanding – RTPY Class B ordinary shares, basic and diluted, |
21,250,000 | |||||||||||||||||||||||||||||||||||
| Net loss per share – Class B, basic and diluted |
$ | (0.00 | ) | |||||||||||||||||||||||||||||||||
| Weighted average shares outstanding – Aurora Class A, basic and diluted |
636,496,966 | |||||||||||||||||||||||||||||||||||
| Net loss per share – Class A, basic and diluted |
$ | (1.02 | ) | |||||||||||||||||||||||||||||||||
| Weighted average shares outstanding – Aurora Class B, basic and diluted |
481,107,977 | |||||||||||||||||||||||||||||||||||
| Net loss per share – Class B, basic and diluted |
$ | (1.02 | ) | |||||||||||||||||||||||||||||||||
-46-
UNAUDITED PRO FORMA CONDENSED COMBINED STATEMENT OF OPERATIONS
FOR THE SIX MONTHS ENDED JUNE 30, 2021
(in thousands, except share and per share amounts)
|
For the Six Months Ended June 30, 2021 Aurora Innovation, Inc. (Historical) |
For the Period from January 1, 2021 to January 19, 2021 Apparate (Historical) |
Apparate Acquisition |
For the Six Months Ended June 30, 2021 RTPY (Historical) |
Transaction Accounting Adjustments |
Pro Forma Combined |
|||||||||||||||||||||||||||
Transaction Accounting Adjustments |
Pro Forma Combined |
|||||||||||||||||||||||||||||||
| Revenue |
$ | — | $ | 5,108 | $ | (5,108 | ) | O | $ | — | $ | — | $ | — | $ | — | ||||||||||||||||
| Operating Expenses |
||||||||||||||||||||||||||||||||
| Research and development |
318,921 | 26,509 | (87,843 | ) | P | 257,587 | — | 9,909 | R | 267,496 | ||||||||||||||||||||||
| Selling, general and administrative |
54,326 | 2,367 | (5,978 | ) | Q | 50,715 | 1,008 | 31 | S | 51,754 | ||||||||||||||||||||||
| |
|
|
|
|
|
|
|
|
|
|
|
|
|
|||||||||||||||||||
| Total operating expenses |
373,247 | 28,876 | (93,821 | ) | 308,302 | 1,008 | 9,940 | 319,250 | ||||||||||||||||||||||||
| |
|
|
|
|
|
|
|
|
|
|
|
|
|
|||||||||||||||||||
| Loss from operations |
(373,247 | ) | (23,768 | ) | 88,713 | (308,302 | ) | (1,008 | ) | (9,940 | ) | (319,250 | ) | |||||||||||||||||||
| |
|
|
|
|
|
|
|
|
|
|
|
|
|
|||||||||||||||||||
| Interest and other income, net |
173 | 141 | — | 314 | — | — | 314 | |||||||||||||||||||||||||
| Fair value adjustments for warrant liability |
— | — | — | — | (3,754 | ) | — | (3,754 | ) | |||||||||||||||||||||||
| Financing costs – derivative warrant liabilities |
— | — | — | — | (1,111 | ) | — | (1,111 | ) | |||||||||||||||||||||||
| Income from investments held in trust account |
— | — | — | — | 44 | (44 | ) | T | — | |||||||||||||||||||||||
| |
|
|
|
|
|
|
|
|
|
|
|
|
|
|||||||||||||||||||
| Loss before income taxes |
$ | (373,074 | ) | $ | (23,627 | ) | $ | 88,713 | $ | (307,988 | ) | (5,829 | ) | (9,984 | ) | $ | (323,801 | ) | ||||||||||||||
| |
|
|
|
|
|
|
|
|
|
|
|
|
|
|||||||||||||||||||
| Income taxes (benefit) expense |
(2,643 | ) | — | — | (2,643 | ) | — | — | (2,643 | ) | ||||||||||||||||||||||
| |
|
|
|
|
|
|
|
|
|
|
|
|
|
|||||||||||||||||||
| Net income (loss) |
$ | (370,431 | ) | $ | (23,627 | ) | $ | 88,713 | $ | (305,345 | ) | $ | (5,829 | ) | $ | (9,984 | ) | $ | (321,158 | ) | ||||||||||||
| |
|
|
|
|
|
|
|
|
|
|
|
|
|
|||||||||||||||||||
| Weighted average shares outstanding, used in computing net loss per share, Aurora, basic and diluted |
236,133,823 | |||||||||||||||||||||||||||||||
| Net loss per share, Aurora, basis and diluted |
$ | (1.57 | ) | |||||||||||||||||||||||||||||
| Weighted average shares outstanding – RTPY Class A ordinary shares, basic and diluted, |
97,746,566 | |||||||||||||||||||||||||||||||
| Net loss per share – Class A, basic and diluted |
$ | — | ||||||||||||||||||||||||||||||
| Weighted average shares outstanding – RTPY Class B ordinary shares, basic and diluted, |
23,099,102 | |||||||||||||||||||||||||||||||
| Net loss per share – Class B, basic and diluted |
$ | (0.25 | ) | |||||||||||||||||||||||||||||
| Weighted average shares outstanding – Aurora Class A, basic and diluted |
636,496,966 | |||||||||||||||||||||||||||||||
| Net loss per share – Class A, basic and diluted |
$ | (0.29 | ) | |||||||||||||||||||||||||||||
| Weighted average shares outstanding – Aurora Class B, basic and diluted |
481,107,977 | |||||||||||||||||||||||||||||||
| Net loss per share – Class B, basic and diluted |
$ | (0.29 | ) | |||||||||||||||||||||||||||||
-47-
NOTES TO UNAUDITED PRO FORMA CONDENSED COMBINED FINANCIAL INFORMATION
Note 1—Basis of Presentation
The Business Combination will be accounted for as a reverse recapitalization, with no goodwill or other intangible assets recorded, in accordance with GAAP. Under this method of accounting, RTPY will be treated as the “acquired” company for financial reporting purposes. Accordingly, for accounting purposes, the Business Combination will be treated as the equivalent of Aurora issuing stock for the net assets of RTPY, accompanied by a recapitalization. The acquisition of Apparate has been treated as a business combination and has been accounted for using the acquisition method with Aurora being the accounting acquirer. Aurora has recorded the fair value of assets and liabilities acquired from Apparate.
The unaudited pro forma combined balance sheet as of June 30, 2021 assumes that the Business Combination occurred on June 30, 2021. The unaudited pro forma combined statement of operations for the year ended December 31, 2020 and for the six months ended June 30, 2021 presents pro forma effect to the Business Combination as if it had been completed on January 1, 2020.
The unaudited pro forma combined balance sheet as of June 30, 2021 has been prepared using, and should be read in conjunction with, the following:
| • | RTPY’s unaudited balance sheet as of June 30, 2021 and the related notes, included elsewhere in this prospectus; and |
| • | Legacy Aurora’s unaudited consolidated balance sheet as of June 30, 2021 and the related notes, included elsewhere in this prospectus. |
The unaudited pro forma condensed combined statement of operations for the six months ended June 30, 2021 has been prepared using, and should be read in conjunction with, the following:
| • | RTPY’s unaudited condensed statement of operations for the six months ended June 30, 2021 and the related notes, included elsewhere in this prospectus; |
| • | Legacy Aurora’s unaudited condensed consolidated statement of operations for the six months ended June 30, 2021 and the related notes, included elsewhere in this prospectus; and |
| • | Apparate’s unaudited financial information provided by Apparate management, for the period from January 1, 2021 through January 19, 2021. |
The unaudited pro forma condensed combined statement of operations for the year ended December 31, 2020 has been prepared using, and should be read in conjunction with, the following:
| • | RTPY’s audited statement of operations for the period between October 2, 2020 (inception) and December 31, 2020 and the related notes, included elsewhere in this prospectus; and |
| • | Legacy Aurora’s audited statement of operations for the year ended December 31, 2020 and the related notes, included elsewhere in this prospectus. |
| • | Apparate’s audited consolidated statement of operations for the year ended December 31, 2020 and the related notes, included elsewhere in this prospectus. |
Management has made significant estimates and assumptions in its determination of the pro forma adjustments. As the unaudited pro forma combined financial information has been prepared based on these preliminary estimates, the final amounts recorded may differ materially from the information presented. The unaudited pro forma combined financial information does not give effect to any anticipated synergies, operating efficiencies, tax savings, or cost savings that may be associated with the Business Combination or Legacy Aurora’s acquisition of Apparate. The pro forma adjustments reflecting the closing of the Business Combination and the acquisition of Apparate are based on certain currently available information and certain assumptions and
-48-
methodologies that Aurora believes are reasonable under the circumstances. The unaudited pro forma adjustments, which are described in the accompanying notes, may be revised as additional information becomes available and is evaluated. Therefore, it is likely that the actual adjustments will differ from the pro forma adjustments and it is possible such differences may be material. Aurora believes that these assumptions and methodologies provide a reasonable basis for presenting all of the significant effects of the Business Combination based on information available to management at the time and that the pro forma adjustments give appropriate effect to those assumptions and are properly applied in the unaudited pro forma combined financial information.
The unaudited pro forma combined financial information is not necessarily indicative of what the actual results of operations and financial position would have been had the Business Combination taken place on the dates indicated, nor are they indicative of the future consolidated results of operations or financial position of the Aurora. They should be read in conjunction with the historical financial statements and notes thereto of RTPY, Legacy Aurora and Apparate.
Note 2—Apparate Transaction
On January 19, 2021, Legacy Aurora acquired 100% of the voting interests of Apparate which was a company developing self-driving technology. The acquisition of Apparate has been treated as a business combination and has been accounted for using the acquisition method.
The acquisition date fair value of the consideration transferred was approximately $1.9 billion which consisted of stock consideration. The stock consideration transferred comprised 50.9 million shares of Legacy Aurora’s
Series U-1
preferred stock and 116.2 million shares of Legacy Aurora’s stock. The preferred stock was valued referencing a subsequent purchase of Legacy Aurora’s preferred stock on the same date as the acquisition. The common stock was valued based on the fair value as of January 19, 2021, as determined by a third-party valuation expert using an Option Pricing Method model. The transaction costs associated with the acquisition were approximately $15.0 million and were recorded in general and administrative expense in 2020 and 2021. The acquisition of Apparate was determined to be a material transaction that is separate from the Business Combination between RTPY and Legacy Aurora. As part of preparing the unaudited pro forma condensed combined statement of operations, Aurora identified certain differences in classification and presentation of Apparate’s financial statements when compared to those of Aurora. The historical statement of operations of Apparate were adjusted, as shown below, to conform presentation and classification of the items noted below to presentation and classification of Aurora.
(in thousands) |
For the period from January 1, 2021 through January 19, 2021 |
For the year ended December 31, 2020 |
||||||
| Revenue |
$ | 5,108 | $ | 100,000 | ||||
| Research and development |
26,509 |
(1) |
649,047 |
(1) | ||||
| Selling, general and administrative |
2,367 |
(1)(2) |
150,637 |
(1)(2) | ||||
| |
|
|
|
|||||
| Loss from operations |
$ | (23,768 | ) | $ | (699,684 | ) | ||
| |
|
|
|
|||||
| Interest and other income, net |
141 | 2,409 | ||||||
| |
|
|
|
|||||
| Total other income (expense) |
$ | 141 | $ | 2,409 | ||||
| |
|
|
|
|||||
| Loss before income taxes |
$ | (23,627 | ) | $ | (697,275 | ) | ||
| |
|
|
|
|||||
| Income tax (benefit) expense |
— | (1,510 | ) | |||||
| |
|
|
|
|||||
| Net loss |
$ |
(23,627 |
) | $ |
(695,765 |
) | ||
| |
|
|
|
|||||
-49-
| (1) | Depreciation and amortization expense were separately disclosed in the Apparate historical statement of operations. In Legacy Aurora’s statement of operations, depreciation and amortization was included as part of research and development and selling general and administrative expenses. |
| (2) | Sales and marketing and general and administrative expenses were separately disclosed in the Apparate historical statement of operations. In Legacy Aurora’s statement of operations, these expenses are presented together. |
Note 3—Accounting Policies
Upon completion of the Business Combination, management will perform a comprehensive review of RTPY’s and Legacy Aurora’s accounting policies. As a result of the review, management may identify differences between the accounting policies of the companies which, when conformed, could have a material impact on the combined financial statements. Based on its initial analysis, management has not identified any material differences in accounting policies that would have a material impact on the unaudited pro forma condensed combined financial information.
Note 4—Adjustments to Unaudited Pro Forma Condensed Combined Financial Information
Article 11 of
Regulation S-X allows
for the presentation of reasonably estimable synergies and other transaction effects that have occurred or are reasonably expected to occur (“Management’s Adjustments”). Aurora has elected not to present Management’s Adjustments and will only be presenting Transaction Accounting Adjustments in the following unaudited pro forma combined financial information. The unaudited pro forma basic and diluted net loss per share amounts presented in the unaudited pro forma combined statements of operations are based upon the number of Aurora shares outstanding, assuming the Business Combination occurred on January 1, 2020
.
The unaudited pro forma condensed combined statement of operations of Legacy Aurora for the year ended December 31, 2020 and six months ended June 30, 2021 takes into consideration if recognition of deferred tax assets is appropriate when realization of these assets is more likely than not. Based upon the weight of all available evidence, with primary focus on Legacy Aurora’s history of recent losses and Aurora being in a net loss position on a pro forma basis, Aurora has concluded that it is not more likely than not that the recorded deferred tax assets will be realized. As a result, the tax effect of the Business Combination and related pro forma adjustments is recorded at no tax expense or benefit to Aurora. The pro forma combined provision for income taxes does not necessarily reflect the amounts that would have resulted had RTPY and Legacy Aurora filed consolidated income tax returns during the period presented.
Adjustments to Unaudited Pro Forma Combined Balance Sheet
The pro forma Transaction Accounting Adjustments, based on preliminary estimates that could change materially as additional information is obtained, are as follows:
A. Represents pro forma adjustments to cash and cash equivalents to reflect the following:
(in thousands) |
Amount |
|||
| Release of cash from trust account |
$ | 977,544 |
(1) | |
| Proceeds from PIPE Investment |
1,000,000 |
(2) | ||
| Payment of deferred underwriting fees and transaction expenses |
(80,062 | ) (3) | ||
| Cash payment for redemptions |
(754,589 | ) (4) | ||
| |
|
|||
| Net adjustment |
$ | 1,142,893 | ||
| |
|
|||
-50-
| (1) | Reflects the reclassification of cash and cash equivalents held in the trust account that becomes available in connection with the Business Combination or to pay redeeming RTPY shareholders. |
| (2) | Reflects the proceeds of $1.0 billion from the issuance and sale of 100.0 million shares of Class A Common Stock, with a per share par value of $0.00001, at $10.00 per share in the PIPE Investment pursuant to the Subscription Agreements. The shares include approximately 40.2 million shares to be purchased by Third Party PIPE Investors, approximately 7.5 million shares to be purchased by Sponsor Related PIPE Investor, and approximately 52.4 million shares to be purchased by Aurora PIPE Investors. The proceeds from the PIPE Investment are reflected with corresponding pro forma adjustments to the par value of Class A Common Stock, as shown in Note 4(J), and additional paid-in capital, as shown in Note 4(M). |
| (3) | Reflects the settlement of approximately $80.1 million of deferred underwriting fees and transaction-related expenses at close in connection with the Business Combination. Of the total, approximately $45.8 million relates to advisory, legal, and other fees to be incurred in conjunction with the Business Combination and $34.2 million relates to RTPY’s deferred underwriting and legal fees. |
The adjustments for expenses incurred in conjunction with the Business Combination are reflected as corresponding adjustments of $25,000 to accounts payable and $3.3 million to accrued expenses for amounts which had been incurred prior to and unpaid as of June 30, 2021, as further noted in Note 4(D). The remaining $42.5 million, representing estimated expenses to be incurred subsequent to June 30, 2021, is reflected as an adjustment to additional
paid-in
capital, as shown in Note 4(M). From the amounts incurred prior to June 30, 2021, approximately $3.5 million, of which approximately $0.2 million had been paid prior to June 30 2021, had been capitalized as deferred transaction costs by Legacy Aurora with the adjustment for these being reflected as a reclassification from prepaid expenses and other current assets to
additional paid-in capital,
as described in Note 4(B). The settlement of RTPY’s deferred underwriting commissions and legal fees, which were incurred by RTPY in conjunction with its initial public offering, are reflected with a corresponding elimination of the liabilities, as further described in Note 4(F) below. Such amounts become payable upon completion of the Business Combination.
| (4) | Reflects the payment to redeeming RTPY public shareholders. The amount of redemptions is approximately 75.5 million shares at a redemption price of $10.00 per share. The corresponding adjustments are a reduction of $7,546 in par value of Class A Common Stock, and a reduction to additional paid-in capital, as shown in Note 4(M). As a result of redemptions, approximately $223.0 million of cash from the trust account was available for the payment of underwriter fees, the payment of transaction costs related to the Merger and for Aurora’s general corporate purposes. |
B. Reflects the reclassification of previously deferred and capitalized transaction costs from prepaid expenses and other current assets to
additional paid-in capital.
C. Reflects the release of $977.5 million of cash currently held in the trust account that became available to effectuate the Business Combination, including payment of redemptions by RTPY shareholders, and for the general use of Aurora upon completion of the Business Combination.
D. Reflects the payment of previously incurred and accrued transaction costs paid upon completion of the Business Combination.
E. Reflects recognition of the derivative liability related to the Sponsor Shares which become subject to price-based vesting upon completion of the Business Combination with a corresponding adjustment
to additional paid-in capital, as
further described in Note 4(M). Upon completion of the Business Combination, these Sponsor Shares will contain certain features which will require these shares to be initially classified as a liability and measured at fair value upon completion of the Business Combination and in subsequent periods. Any changes in the fair value will be reflected in earnings until the vesting conditions for such shares are met or -51-
expire. The fair value of the derivative liability is determined by using the Monte-Carlo Simulation approach, which estimates the number of Sponsor Shares expected to vest and their value based on a simulation of the post-combination company’s common stock price in the future.
F. Reflects the payment of approximately $34.2 million of deferred underwriters’ commissions and deferred legal fees incurred during RTPY’s initial public offering and due upon completion of the Business Combination.
G. Reflects conversion of Legacy Aurora preferred stock into Legacy Aurora common stock pursuant to the terms of the Merger Agreement, and as a result
of the Pre-Closing Restructuring, resulting
in an adjustment of $2.2 billion from temporary equity to additional paid-in capital, as
shown in Note 4(M) and an adjustment of $20,000 to Legacy Aurora common stock, Note 4(L). H. Reflects the reclassification of Class A ordinary shares of $900.4 million to permanent equity with the reclassification shown as an adjustment to par value and additional
paid-in
capital prior to the impact of redemptions in Note 4(J) and Note 4(M). I. Reflects the conversion of RTPY Class A and Class B ordinary shares to Class A Common Stock in conjunction with the Domestication and pursuant to terms of the Merger Agreement.
J. Represents pro forma adjustments to par value of Class A Common Stock balance to reflect the following:
(in thousands) |
Amount |
|||
| Recapitalization of Legacy Aurora common stock into Aurora common stock |
$ | 51 | ||
| Reclassification of RTPY public shares to permanent equity, prior to impact of redemptions |
9 | |||
| Issuance of Class A Common Stock from PIPE Investment per Subscription Agreements |
10 | |||
| Conversion of RTPY Class A and Class B ordinary shares into Class A Common Stock as a result of the Domestication |
1 | |||
| Decrease due to redemption of RTPY public shares |
(8 | ) | ||
| |
|
|||
| Net adjustment |
$ | 63 | ||
| |
|
|||
K. Represents recapitalization of Legacy Aurora common stock to Class B Common Stock issuable to certain Legacy Aurora Stockholders.
L. Reflects conversion and recapitalization of Legacy Aurora common stock to Aurora common stock, as follows:
(in thousands) |
Amount |
|||
| Increase in par value of Legacy Aurora common stock as a result of Legacy Aurora preferred stock converting into Legacy Aurora common stock |
20 | |||
| Elimination and recapitalization of par value of Legacy Aurora common stock, inclusive of par value of Legacy Aurora common stock issued upon conversion of Legacy Aurora preferred stock |
(45 | ) | ||
| |
|
|||
| Net adjustment |
$ | (25 | ) | |
| |
|
|||
-52-
M. Represents pro forma adjustments
to additional paid-in capital balance
to reflect the following: (in thousands) |
Amount |
|||
| Conversion of Legacy Aurora preferred stock into Legacy Aurora common stock |
$ | 2,161,125 | ||
| Reclassification of RTPY public shares to permanent equity, prior to impact of redemptions |
900,367 | |||
| Issuance of Class A Common Stock from PIPE Investment per Subscription Agreements |
999,990 | |||
| Cumulative catch-up expense for Aurora RSUs |
51,203 |
(1) | ||
| Record fair value of liability related to the Sponsor Shares which became subject to price-based vesting upon completion of the Business Combination |
(46,941 | ) | ||
| Reclassification of Aurora’s previously deferred transaction costs |
(3,476 | ) | ||
| Reduction in additional paid-in capital for acquisition-related transaction expenses to be incurred |
(42,465 | ) | ||
| Elimination of RTPY’s historical accumulated deficit |
(5,848 | ) | ||
| Impact of the Domestication to additional paid-in capital |
2 | |||
| Recapitalization of Legacy Aurora common stock into Aurora common stock |
(54 | ) | ||
| Reduction in additional paid-in capital due to actual redemptions |
(754,581 | ) | ||
| |
|
|||
| Net adjustment |
$ | 3,259,322 | ||
| |
|
|||
| (1) | Represents the stock-based compensation for certain Aurora RSUs subject to (i) time-based vesting conditions and (ii) a performance-based condition tied to achievement of a liquidity event. Upon completion of the Business Combination, the performance-based vesting condition was met, resulting in Aurora recognizing a cumulative catch-up expense for pro forma presentation purposes. |
N. Reflects the elimination of the historical accumulated deficit of RTPY in connection with the recapitalization and
the cumulative catch-up expense adjustment
for Aurora RSUs with corresponding adjustments to additional paid-in capital, both
of which are also reflected in Note 4(M). Adjustments to Unaudited Pro Forma Condensed Combined Statement of Operations
The pro forma adjustments included in the unaudited pro forma condensed combined statement of operations for the year ended December 31, 2020, and the six months ended June 30, 2021 are as follows:
O. As a result of the Apparate acquisition, Apparate’s sole revenue-producing customer contract was cancelled and subsequently renegotiated. The renegotiated terms had not been settled at the time of close of the acquisition. As such, the historical Apparate revenue was eliminated for pro forma presentation purposes and no contractual revenue from the previous Apparate customer has been recorded in Legacy Aurora’s historical financial statements subsequent to the closing of the Apparate acquisition.
-53-
P. The Transaction Accounting Adjustments to research and development expense for the Apparate acquisition as follows:
(in thousands) |
For the six months ended June 30, 2021 |
For the year ended December 31, 2020 |
||||||
| Elimination of historical depreciation and amortization expense on Apparate’s fixed assets |
$ | (610 | ) (1) |
$ | (12,459 | ) (1) | ||
| Elimination of historical Uber RSU stock-based compensation expense |
(11,579 | ) | (103,452 | ) | ||||
| To record adjustment for severance expense |
(12,641 | ) (2) |
12,641 |
(2) | ||||
| To record pro forma depreciation and amortization expense on Apparate’s fixed assets based on the fair value as of the acquisition date |
17 |
(1) |
3,446 |
(1) | ||||
| To record pro forma share-based compensation related to related-party share-based compensation payments |
(63,030 | ) (3) |
136,233 |
(3) | ||||
| |
|
|
|
|||||
| Net adjustment |
$ | (87,843 | ) | $ | 36,409 | |||
| |
|
|
|
|||||
| (1) | Amortization expense existed in the historical period and not in the future periods as the fair value of the historical intangible assets was zero in the post-acquisition period. The pro forma adjustments include the net impact of recording depreciation expense based on the acquisition date fair value of the acquired fixed assets and removing historically recorded depreciation expense for the periods presented assuming that the acquisition of Apparate had been completed on January 1, 2020. During the period from January 20, 2021 to June 30, 2021, Legacy Aurora recorded $1.7 million in depreciation expense relating to the acquired fixed assets and the pro forma depreciation expense for the six months ended June 30, 2021 is presented net of such expense. |
| (2) | During the six months ended June 30, 2021, Legacy Aurora recorded $15.8 million, of which approximately $12.6 million was recorded in research and development expenses, in severance expense in conjunction with the Apparate acquisition. The pro forma adjustments include the net impact of removing the historically recorded expense for the periods presented, assuming that the acquisition of Apparate had been completed on January 1, 2020. |
| (3) | Former employees of Apparate received grants of RSUs in a related party entity in connection with their employment with a subsidiary of the related party entity prior to the acquisition. These awards were modified after the transaction to allow the awards to continue to vest for the first year subsequent to the closing of the acquisition as long as the personnel remain employees of Aurora. As the RSUs were a modification to previously held awards by these employees in the historical period and the acquisition accounting measured the awards at fair value under stock-based compensation guidance, the stock-based compensation expense in the historical periods was eliminated and adjusted to reflect the fair value of the awards. During the six months ended June 30, 2021, Legacy Aurora recorded $63.0 million in expense relating to these awards and the pro forma adjustments include the net impact of removing the historically recorded expense for the periods presented assuming that the acquisition of Apparate had been completed on January 1, 2020 and the vesting period would have concluded on December 31, 2020. In addition, former employees of Apparate received Aurora restricted stock units which have service-based and performance-based vesting conditions with performance-based vesting condition tied to achievement of a liquidity event. Upon completion of the Business Combination, the performance-based vesting condition was met with the pro forma impact of such restricted stock units reflected as an adjustment in Note 4(R) and Note 4(S). |
-54-
Q. The Transaction Accounting Adjustments to selling, general and administrative expenses for the Apparate acquisition are as follows:
(in thousands) |
For the six months ended June 30, 2021 |
For the year ended December 31, 2020 |
||||||
| Elimination of historical depreciation expense on Apparate’s fixed assets |
$ | (453 | ) (1) |
$ | (8,459 | ) (1) | ||
| Elimination of historical Uber RSU stock-based compensation expense |
(849 | ) | (9,952 | ) | ||||
| To record adjustment for severance expense |
(3,105 | ) (2) |
3,105 |
(2) | ||||
| To record pro forma depreciation expense on Apparate’s fixed assets based on the fair value as of the acquisition date |
393 |
(1) |
7,225 |
(1) | ||||
| To record pro forma share-based compensation related to related-party share-based compensation payments |
(1,964 | ) (3) |
4,269 |
(3) | ||||
| |
|
|
|
|||||
| Net adjustment |
$ | (5,978 | ) | $ | (3,812 | ) | ||
| |
|
|
|
|||||
| (1) | The pro forma adjustments include the net impact of recording depreciation expense based on the acquisition date fair value of the acquired fixed assets and removing historically recorded depreciation expense for the periods presented assuming that the acquisition of Apparate had been completed on January 1, 2020. During the period from January 20, 2021 to June 30, 2021, Legacy Aurora recorded $3.2 million in depreciation expense relating to the acquired fixed assets and the pro forma depreciation expense for the six months ended June 30, 2021 is presented net of such expense. |
| (2) | During the six months ended June 30, 2021, Legacy Aurora recorded $15.8 million in severance expense, of which approximately $3.1 million was recorded in selling, general and administrative expenses, in conjunction with the Apparate acquisition. The pro forma adjustments include the net impact of removing the historically recorded expense for the periods presented, assuming that the acquisition of Apparate had been completed on January 1, 2020. |
| (3) | Former employees of Apparate received grants of RSUs in a related party entity in connection with their employment with a subsidiary of the related party entity prior to the acquisition. These awards were modified after the transaction to allow the awards to continue to vest for the first year subsequent to the closing of the acquisition as long as the personnel remain employees of Legacy Aurora. As the RSUs were a modification to previously held awards by these employees in the historical period and the acquisition accounting measured the awards at fair value under stock-based compensation guidance, the stock-based compensation expense in the historical periods was eliminated and adjusted to reflect the fair value of the awards. During the six months ended June 30, 2021, Legacy Aurora recorded $2.0 million in expense relating to these awards and the pro forma adjustments include the net impact of removing the historically recorded expense for the periods presented assuming that the acquisition of Apparate had been completed on January 1, 2020 and the vesting period would have concluded on December 31, 2020. |
In addition, former employees of Apparate received Legacy Aurora restricted stock units which have a service-based and performance-based vesting conditions with performance-based vesting condition tied to achievement of a liquidity event. Upon completion of the Business Combination, the performance-based vesting condition is met with the pro forma impact of such restricted stock units reflects as an adjustment in Note 4(R) and Note 4(S).
-55-
R. The Transaction Accounting Adjustments to research and development expense for the Business Combination and related transactions are as follows:
(in thousands) |
For the six months ended June 30, 2021 |
For the year ended December 31, 2020 |
||||||
| To record pro forma share-based compensation related to Legacy Aurora restricted stock units |
$ | 9,909 |
(1) |
$ | 88,583 |
(1) | ||
| |
|
|
|
|||||
| Net adjustment |
$ | 9,909 | $ | 88,583 | ||||
| |
|
|
|
|||||
| (1) | Certain Legacy Aurora restricted stock units are subject to (i) time-based vesting conditions and (ii) a performance-based condition tied to achievement of a liquidity event. Upon completion of the Business Combination, the performance-based vesting condition was met, resulting in a cumulative catch-up expense of $47.8 million for pro forma presentation purposes. Such cumulative catch-up expense is reflected in the year ended December 31, 2020. The remaining expense will be recognized over the remaining time-based vesting condition following the completion of the Business Combination, assuming that the Business Combination had been completed on January 1, 2020 for pro forma presentation purposes. |
S. The Transaction Accounting Adjustments to selling, general and administrative expense for the Business Combination and related transactions are as follows:
(in thousands) |
For the year ended December 31, 2020 |
For the six months ended June 30, 2021 |
||||||
| To record pro forma share-based compensation related to Legacy Aurora restricted stock units |
$ | 500 |
(1) |
$ | 5,903 |
(1) | ||
| Elimination of expenses incurred by RTPY for certain support services |
(469 | ) (2) |
— | |||||
| |
|
|
|
|||||
| Net adjustment |
$ | 31 | $ | 5,903 | ||||
| |
|
|
|
|||||
| (1) | Certain Legacy Aurora restricted stock units are subject to (i) time-based vesting conditions and (ii) a performance-based condition tied to achievement of a liquidity event. Upon completion of the Business Combination, the performance-based vesting condition was met, resulting in a cumulative catch-up expense of $3.4 million for pro forma presentation purposes. Such cumulative catch-up expense is reflected in the year ended December 31, 2020. The remaining expense will be recognized over the remaining time-based vesting condition following the completion of the Business Combination, assuming that the Business Combination had been completed on January 1, 2020 for pro forma presentation purposes. |
| (2) | Reflects the elimination of expense related to RTPY’s support services which ceased upon completion of the Business Combination. |
T. Reflects the elimination of unrealized gains on investments held in the trust account.
Note 5—Net Loss Per Share
Represents the net loss per share calculated using the historical weighted average shares outstanding and the issuance of additional shares in connection with the Business Combination, the PIPE Investment, and other related events, assuming such additional shares were outstanding since January 1, 2020. As the Business Combination, and PIPE Investment are being reflected as if they had occurred as of January 1, 2020, the calculation of weighted average shares outstanding for basic and diluted net loss per share assumes the shares issued in connection with the Business Combination and PIPE Investment have been outstanding for the entire
-56-
periods presented. Under the maximum redemption scenario, the shares of Aurora common stock assumed to be redeemed by RTPY public shareholders are eliminated as of January 1, 2020.
(in thousands, except share and per share data) |
For the six months ended June 30, 2021 |
For the year ended December 31, 2020 |
||||||
| Pro forma loss attributable to common stockholders—Class A and Class B |
$ | (321,158 | ) | $ | (1,137,316 | ) | ||
| Combined Entity Class A Common Stock |
||||||||
| Weighted average shares outstanding—Class A, basic and diluted |
636,496,966 | 636,496,966 | ||||||
| Net loss per share—Class A, basic and diluted |
$ | (0.29 | ) | $ | (1.02 | ) | ||
| Combined Entity Class B Common Stock |
||||||||
| Weighted average shares outstanding—Class B, basic and diluted |
481,107,977 | 481,107,977 | ||||||
| Net loss per share—Class B, basic and diluted |
$ | (0.29 | ) | $ | (1.02 | ) | ||
The following summarizes the number of shares of Class A Common Stock outstanding for both the six months ended June 30, 2021 and year ended December 31, 2020:
| Legacy Aurora Stockholders (1)
|
564,715,105 | |||
| RTPY’s public shareholders |
22,291,089 | |||
| PIPE Investors |
40,150,000 | |||
| Sponsor and Sponsor Related PIPE Investor (2)
|
9,340,772 | |||
| |
|
|||
| Pro forma weighted average shares outstanding— basic and diluted |
636,496,966 | |||
| |
|
| (1) | Excludes approximately 1.2 million restricted shares or shares issued for early exercised options, subject to a repurchase right, and includes approximately 52.4 million shares to be purchased by Aurora PIPE Investors as part of the PIPE Investment. |
| (2) | Includes 7.5 million shares to be purchased by Sponsor Related PIPE Investor as part of the PIPE Investment. |
The following potential outstanding securities were excluded from the computation of pro forma net loss per share, basic and diluted, because their effect would have been anti-dilutive or issuance of such shares is contingent upon the satisfaction of certain conditions which are not satisfied as of the period end for pro forma presentation purposes.
| Sponsor Shares subject to price-based vesting conditions |
5,162,314 | |||
| Public warrants and Private Placement Warrants |
21,118,750 | |||
| Aurora options and restricted stock units |
117,131,430 | |||
| Aurora restricted stock and shares issued for early exercised options, subject to a repurchase right |
1,210,268 |
-57-
MANAGEMENT’S DISCUSSION AND ANALYSIS OF
FINANCIAL CONDITION AND RESULTS OF OPERATIONS
As a result of the closing of the Merger, the financial statements of Legacy Aurora are now the financial statements of Aurora. Thus, the following discussion and analysis of our financial condition and results of operations of Legacy Aurora prior to the Merger and Aurora following the completion of the Merger should be read together with Legacy Aurora’s consolidated financial statements and the related notes appearing elsewhere in this prospectus. The discussion and analysis should also be read together with the pro forma financial information as of June 30, 2021 and for the six months ended June 30, 2021 and the year ended December 31, 2020 and 2019 included in this prospectus. See “Unaudited Pro Forma Condensed Combined Financial Information.” Some of the information contained in this discussion and analysis or set forth elsewhere in this prospectus, including information with respect to our plans and strategy for our business, includes forward-looking statements that involve risks and uncertainties. You should read the sections titled “Risk Factors” and “Cautionary Note Regarding Forward-Looking Statements” for a discussion of important factors that could cause actual results to differ materially from the results described in or implied by the forward-looking statements contained in the following discussion and analysis.
Overview
Aurora is developing the Aurora Driver based on what it believes to be the most advanced and scalable suite of self-driving hardware, software, and data services in the world to fundamentally transform the over $9 trillion global transportation market. The Aurora Driver is designed as a platform to adapt and interoperate amongst vehicle types and applications. As of September 30, 2021, it has been successfully integrated into eight different vehicle platforms: from passenger vehicles to light commercial vehicles to Class 8 trucks. By creating one driver system for multiple vehicle types and use cases, Aurora’s capabilities in one market reinforce and strengthen its competitive advantages in others. For example, highway driving capabilities developed for trucking will carry to highway segments driven by passenger vehicles in ride hailing applications. We believe this approach will enable us to target and transform multiple massive markets, including the $4 trillion global trucking market, the $5 trillion global passenger mobility market, and the $400 billion U.S. local goods delivery market.
We expect that the Aurora Driver will ultimately be commercialized in a Driver as a Service (“DaaS”) business model, in which we will supply self-driving technology. We do not intend to own nor operate a large number of vehicles ourselves. Throughout commercialization, we expect to earn revenue on a fee per mile basis. We intend to partner with OEMs, fleet operators, and other third parties to commercialize and support Aurora-powered vehicles. We expect that these strategic partners will support activities such as vehicle manufacturing, financing and leasing, service and maintenance, parts replacement, facility ownership and operation, and other commercial and operational services as needed. During the start of commercialization, though, we expect to briefly operate our own logistics and mobility services, where we own and operate a small fleet of vehicles equipped with our Aurora Driver. This level of control is useful during early commercialization as we will define operational processes and playbooks for our partners.
We intend to launch trucking as our first driverless product, as we believe that is where we can make the largest impact the fastest, given the massive industry demand, attractive unit economics, and the ability to deploy on high volume highway-focused routes. From there, we plan to leverage the extensibility of the Aurora Driver to deploy and scale into the passenger mobility and local goods delivery markets.
Our Business Model
The Aurora Driver will be delivered as a service. We intend to partner with our ecosystem of OEMs, fleet operators, and mobility and logistics services, and other third parties to commercialize and support Aurora-powered vehicles. Our business model is for fleet owners to purchase Aurora Driver-powered vehicles from our
-58-
OEM partners, subscribe to the Aurora Driver, and utilize Aurora-certified fleet service partners to operate autonomous mobility and logistics services. In many instances, the same party may play multiple roles: for example, our OEM partners will in certain cases also provide maintenance services and act as a fleet operator. We expect this DaaS model to enable an asset-light and high margin revenue stream for us, while allowing us to scale more rapidly through partnerships.
Significant Events and Transactions
The Business Combination and Public Company Costs
On November 3, 2021, Reinvent Technology Partners Y, our legal predecessor company and a special purpose acquisition company
co-founded
by Mr. Hoffman, Mr. Pincus, and Michael Thompson that closed its initial public offering in March 2021, consummated the previously announced merger with Legacy Aurora and RTPY Merger Sub, Inc., a Delaware corporation and a wholly owned subsidiary of RTPY. Pursuant to the Merger, Merger Sub merged with and into Legacy Aurora, the separate corporate existence of Merger Sub ceased, and Legacy Aurora continued as the surviving corporation in the Merger and as a wholly owned subsidiary of RTPY. The Merger was approved by RTPY’s stockholders at a meeting held on November 2, 2021. On the Closing Date, RTPY changed its name to Aurora Innovation, Inc. The Merger will be accounted for as a reverse recapitalization under GAAP because Legacy Aurora has been determined to be the accounting acquirer under ASC 805. Under this method of accounting, RTPY will be treated as the “acquired” company for financial reporting purposes. Accordingly, the consolidated assets, liabilities and results of operations of Legacy Aurora will become the historical financial statements of Aurora, and RTPY’s assets, liabilities and results of operations will be consolidated with Legacy Aurora’s beginning on the acquisition date. For accounting purposes, the financial statements of Aurora will represent a continuation of the financial statements of Legacy Aurora with the Merger being treated as the equivalent of Legacy Aurora issuing stock for the net assets of RTPY, accompanied by a recapitalization. The net assets of RTPY will be stated at historical costs and no goodwill or other intangible assets will be recorded. Operations prior to the Merger will be presented as those of Legacy Aurora in future reports of Aurora. See “.”
Unaudited Pro Forma Condensed Combined Financial Information
The most significant change in Aurora’s future reported financial position and results flowing from the Merger was a net increase in cash (as compared to Legacy Aurora’s consolidated balance sheet at June 30, 2021). As a result of the Merger, we raised gross proceeds of $1.2 billion, including the contribution of $0.2 billion of cash held in RTPY’s trust account from its initial public offering, net of the redemption of RTPY common stock held by RTPY’s public stockholders of $0.8 billion and $1 billion private investment in public equity at $10.00 per share of our Class A Common Stock. As a result of the Merger, we received net proceeds of $1.1 billion, net of estimated transaction costs of $0.1 billion.
As a result of the Merger, we became the successor to an
SEC-registered
and Nasdaq-listed company, which requires us to hire additional personnel and implement procedures and processes to address public company regulatory requirements and customary practices. We expect to incur additional annual expenses as a public company for, among other things, directors’ and officers’ liability insurance premiums, which are substantial, director fees, and additional internal and external accounting, legal and administrative resources. Apparate Business Combination
On January 19, 2021, Aurora acquired 100% of the voting interests of Apparate, the self-driving technology division of Uber. The acquisition date fair value of the consideration transferred was approximately $1.9 billion, which consisted of both preferred and common stock issued to the shareholders of Apparate. Aurora accounted for the acquisition as a business combination and recognized the assets acquired and liabilities assumed at fair value on the date of acquisition. The excess of purchase consideration over the fair value of the assets acquired was recorded as goodwill.
-59-
COVID-19 Impact
The spread
of COVID-19 caused
us to modify our business practices (including reducing employee travel, recommending that all non-essential personnel
work from home and cancelling or reducing physical participation in activities, meetings, events and conferences), and we may take further actions as may be required by government authorities or that we determine are in the best interests of our employees, suppliers, and business partners. All of our products and services are in a research phase of development and do not involve physical customer interaction. Therefore, our ability to meet our business expectations and customers’ needs has not been materially impaired due to
this COVID-19 pandemic.
Even though the global economic implications remain uncertain, this pandemic has not yet had any measurable material impact on our operating results. At the same time, we will continue to actively monitor the pandemic situation and may take further actions to modify our business practices as may be required by federal, state, or local authorities or that we determine are in the best interests of our employees and customers. Key Factors Affecting Our Results
Our financial position and results of operations depend to a significant extent on the following factors:
Development of Our Technology
Since Aurora’s inception, we have focused on attracting and to solve self-driving’s most difficult challenges. We continue to invest heavily in employee recruitment and retention to advance our technology. Additionally, our team has made purposeful and foundational technological investments in key aspects of self-driving hardware and software. We believe these early investments in our technology will enable us to move toward commercialization more safely and quickly than would otherwise be possible. When we have deemed it to be beneficial, we have entered into strategic acquisitions to expand and accelerate our technology development.
retaining best-in-class talent
We believe that our developmental approach provides us with meaningful technological advantages in areas such as our lidar technology, fusion of machine learning and engineered approaches, common driver platform, virtual testing, and high definition maps. The successful execution of these details of self-driving technology is what we believe will allow us to differentiate ourselves by developing leading self-driving technology that can safely and reliably navigate its environment. By developing a substantial part of this
technology in-house, we
ensure that the various inputs and components of our autonomy stack integrate successfully and reduce our reliance on third parties for key aspects of our commercial product offering. While we believe we are best positioned to address advanced autonomous solutions in trucking and passenger mobility, potential competition may exist from other autonomous technology providers using other approaches. Future success will be dependent on our ability to continue to execute against our product roadmap, which includes milestones to commercialize the Aurora Driver in late 2023 for trucking and late 2024 for ride hailing.
Commercialization and Strategic Partnerships
We anticipate robust demand for the Aurora Driver. We intend to launch first in trucking, a $700 billion industry in the U.S. in 2019. Further, we have multiple levers for sustained growth and adjacent market opportunities, with a core strategy to focus on attractive markets with significant growth and profitability potential. We expect to penetrate into other verticals such as the ride hailing market, $35 billion in the U.S., and local goods delivery market, $100 billion in the U.S., both of which have significant growth potential. Each such market also has a potentially significant global opportunity that we intend to address over time.
-60-
Key customers in trucking
include for-hire carriers
and private fleets. To meet these customers’ needs, we have formed strategic partnerships with two leading truck OEMs who together represent approximately 50% of the U.S. Class 8 truck sales. Aurora’s strategic partnerships with truck OEMs include PACCAR (representing Peterbilt & Kenworth brands) and Volvo Trucks. Our OEM partnerships represent an ability to deploy self-driving trucks at scale, allowing the Aurora Driver to expand quickly. We expect to launch the Aurora Driver for the trucking market in late 2023. Currently, there is a significant driver shortage and we expect to provide access to safe, efficient, and consistent operation at an attractive total cost of ownership (“TCO”). We see our existing partner base as a substantial competitive advantage. Our second commercial use case will be passenger mobility. In this space, we have formed strategic partnerships with Uber and Toyota, which will be key enablers to our growth in this segment. Currently,
our ten-year agreement
with Uber provides us access to Uber network data to refine market selection, to enable better roadmap prioritization, and to optimize commercial fleet operations in an effort to further develop and monetize our Aurora Driver for passenger mobility. We are collaborating with Toyota to integrate the Aurora Driver into driverless-capable Toyota Sienna minivans. We expect to launch the Aurora Driver for the passenger mobility market in late 2024. Over time, we anticipate the Aurora Driver will allow ride hailing to be offered at price points that are more cost-competitive with personal vehicle ownership. Our ability to achieve profitability depends upon progression of technological and commercial milestones in order to meet required volumes and economies of scale to cover overhead. Delays in development timelines or technological integration with third parties that we are currently or will be working with could result in us being unable to achieve its revenue targets and profitability in the time frame it anticipates. We anticipate that we will begin generating driverless revenue in late 2023, all of which is projected to be earned within the trucking market. We intend to pursue additional partnerships to support fleet operations and broaden our commercialization opportunities. The successful progression of our partnerships is expected to result in Aurora Driver integrations that scale each year as we successfully implement the DaaS business model.
Should Aurora’s assumptions about the commercialization of its technology prove overly optimistic or if we are unable to develop, obtain, or progress third party partnerships into successful commercialization of the Aurora Driver, We may fail to generate operating cash flow and may incur delays to its ability to achieve profitability. This may also lead us to make changes in which could result in unanticipated delays or cost overruns, which could in turn adversely impact margins and cash flows.
its go-to-market plans,
Economies of Scale, Sales and Marketing, & Competition
We believe that our DaaS model will give us the opportunity to establish high margin unit economics when operating at scale. Our future performance will depend on our ability to deliver on these economies of scale with higher volume. We believe our business model is positioned for scalability by leveraging third party partnerships so that we can focus its efforts on core technology development. We expect revenue will be based on miles traveled for each truck equipped with the Aurora Driver.
Once we have transitioned to DaaS we plan to operate in a capital light model and do not expect that we will require significant capital expenditures as revenues grow. Improvements from scale are expected to increase truck gross margins.
While we expect to achieve and maintain high margins on the Aurora Driver technology for trucking and passenger mobility, emergence of competition in advanced autonomous driving technologies may negatively impact pricing, margins, and market share. As we operate on a fee per mile basis, it is possible that competition may lead to pricing pressure and lower margins that negatively impact operating results. However, we believe our unique technology provides a compelling value proposition for favorable margins and unit economics in industries with increasing demand for driver supply. If we do not generate the margins we expect upon commercialization of our DaaS model, we may be required to raise additional debt or equity capital, which may not be available or may only be available on terms that are onerous to our stockholders.
-61-
Key Components of Sales and Expenses
Basis of Presentation
Currently, we conduct business through one operating segment. Substantially all our property and equipment are maintained in, and our losses are attributable to, the United States. The consolidated financial statements include the accounts of Aurora Innovation, Inc., and its wholly owned subsidiaries. See Note 2 to Aurora’s financial statements for more information on the basis of presentation and operating segments.
Revenue
In 2019, Aurora recognized development services revenue based on contracts in force at the time. We do not expect development services revenue to continue into the future. Development services revenue was derived from revenue earned
on non-recurring
development service agreements to research, design, and implement the Aurora Driver. Development services are recognized over time as we perform the underlying services and satisfy the performance obligations. Revenue allocable to hardware design and development services are recognized over time based on the hours incurred. In January 2021, we entered into a collaboration framework agreement with Toyota with the intention of deploying the Aurora Driver into a fleet of Toyota Sienna vehicles, subject to further agreement of a collaboration project plan. In April 2021, we received a $50 million payment from Toyota as a part of this collaboration agreement and it is recorded as a deposit liability pending finalization of the project plan. In August 2021, the project plan was agreed and signed which includes $100,000 in fees expected to be collected by May 2022 in addition to the $50,000 received in April 2021.
Once we reach commercialization, our DaaS business model will become our primary revenue source. We expect to derive recurring revenue
from per-mile fees
charged to users of the Aurora Driver. Recognition of this future revenue will be subject to the terms of any arrangements with our partners or users, which have not yet been negotiated. To date, we have not recorded any revenue under this model. Cost of Revenue
Cost of revenue consists of costs related to development services revenue, which is comprised of costs associated with delivering customer hardware design and development services for operating a customer’s vehicle platform with the Aurora Driver. These costs consist primarily of payroll, payroll-related expense, stock-based compensation and allocated overhead incurred as the Company performs the underlying services related to satisfying the performance obligations under the development services agreements.
As we transition towards commercialization, we expect cost of revenue to increasingly be comprised of costs needed to support the Aurora Driver. We expect these costs may include, but not be limited to, insurance, teleassistance service, telecom connectivity, cloud services, hardware, and OEM licensing fees. In early commercialization, where we will operate a fleet, we expect we will incur additional cost of revenue, for example fuel costs, that we do not expect to continue significantly as we transition to our DaaS model. As this represents a new offering, we will evolve the specifics of our service bundle in partnership with our customers.
Research and Development
Research and development costs are expensed as incurred. Research and development costs consist of payroll, hardware and electrical engineering prototyping, cloud computing, data labeling, and third-party development services, as well as costs associated with vehicle operations for our test fleet of vehicles. These costs are included within research and development within the statement of operations. We expect our research and development expenses to increase in absolute dollars as we increase our investment in scaling our proprietary technologies.
-62-
Selling, General and Administrative
Selling, general and administrative costs consist primarily of personnel-related expenses such as salaries, wages and benefits as well as stock-based compensation. Selling, general and administrative also includes professional service fees, marketing and other general corporate expenses.
Following the completion of this offering, we expect to incur additional selling, general and administrative expenses as a result of operating as a public company, including expenses related to compliance with the rules and regulations of the SEC and stock exchange listing standards, additional insurance expenses, investor relations activities, and other administrative and professional services. We also expect to increase the size of our selling, general and administrative function to support the growth of our business. As a result, we expect that our selling, general and administrative expenses will increase in absolute dollars.
Interest Income
Aurora earns interest income through investments in money market securities and U.S. Treasury securities, which are classified as both cash and cash equivalents and short-term investments on the statement of financial position and are classified
as available-for-sale.
Income Tax Expense (Benefit)
Provision for income taxes consists of U.S. federal and state income taxes and income taxes. Since inception, we have incurred operating losses. We have a valuation allowance for net deferred tax assets, including federal and state net operating loss carryforwards and research and development credit carryforwards. We expect to maintain this valuation allowance until it becomes more likely than not that the benefit of our federal and state deferred tax assets will be realized by way of expected future taxable income.
Results of Operations
Comparison of the Six Months Ended June 30, 2021, to Six Months Ended June 30, 2020
The following table sets forth a summary of our consolidated results of operations for the periods indicated, and the changes between periods.
Six Months ended June 30, |
||||||||||||||||
2021 |
2020 |
$ Change |
% Change |
|||||||||||||
(in thousands, except for percentages) |
||||||||||||||||
| Operating expenses: |
||||||||||||||||
| Research and development |
$ | 318,921 | $ | 75,580 | $ | 243,341 | 321.96 | % | ||||||||
| Selling, general, and administrative |
54,326 | 14,702 | 39,624 | 269.51 | % | |||||||||||
| |
|
|
|
|
|
|
|
|||||||||
| Loss from operations |
(373,247 | ) | (90,282 | ) | (282,965 | ) | 313.42 | % | ||||||||
| |
|
|
|
|
|
|
|
|||||||||
| Other income (expense): |
||||||||||||||||
| Interest and other income |
261 | 3,217 | (2,956 | ) | (91.89 | )% | ||||||||||
| Other expense |
(88 | ) | (4 | ) | (84 | ) | n/m |
(1) | ||||||||
| |
|
|
|
|
|
|
|
|||||||||
| Loss before income taxes |
(373,074 | ) | (87,069 | ) | (286,005 | ) | 328.48 | % | ||||||||
| Income tax benefit |
(2,643 | ) | — | (2,643 | ) | n/m |
(1) | |||||||||
| |
|
|
|
|
|
|
|
|||||||||
| Net loss |
$ | (370,431 | ) | $ | (87,069 | ) | $ | (283,362 | ) | $ | 325.45 | % | ||||
| (1) | Not meaningful. |
-63-
Research and Development
Research and development increased by $243.3 million for the six months ended June 30, 2021, or 322.0%, to $319.0 million in 2021 from $75.6 million in 2020, primarily driven by an increase in headcount from acquisitions and from continued hiring to effectively scale the growth of our business. Payroll costs related to research and development increased
$117.1 million, non-payroll hardware
development costs increased $12.3 million, non-payroll software
development costs increased $27.1 million, and stock-based compensation increased $66.8 million. Selling, General and Administrative
Selling, general, and administrative expense increased by $39.6 million for the six months ended June 30, 2021, or 269.5%, to $54.3 million in the six months ended June 30, 2021 from $14.7 million in the six months ended June 30, 2020, primarily driven by an increase in professional services costs of $15.8 million and an increase in payroll costs of $14.2 million from continued hiring to effectively support the growth of our business.
Interest and Other Income
Interest and other income decreased by $3.0 million for the six months ended June 30, 2021, or 91.9%, to $0.3 million in the six months ended June 30, 2021 from $3.2 million in the six months ended June 30, 2020, primarily driven by investments in money market accounts with lower interest rates.
Income Tax Benefit
Income tax benefit was $2.6 million for the six months ended June 30, 2021 due to the release of a deferred tax asset valuation allowance as a result of deferred tax liabilities incurred from the acquisition of OURS Technology, Inc.
Net Income (Loss)
Net loss increased $283.4 million to $370.4 million for the six months ended June 30, 2021, from $87.1 million for the six months ended June 30, 2020, for the reasons discussed above.
Comparison of Year Ended December 31, 2020, to Year Ended December 31, 2019
The following table sets forth a summary of our consolidated results of operations for the years indicated, and the changes between periods.
Years ended December 31, |
||||||||||||||||
2020 |
2019 |
$ Change |
% Change |
|||||||||||||
(in thousands, except for percentages) |
||||||||||||||||
| Development and services revenue |
$ | — | $ | 19,601 | $ | (19,601 | ) | n/m |
(1) | |||||||
| Operating expenses: |
||||||||||||||||
| Cost of revenue |
— | 160 | (160 | ) | n/m |
(1) | ||||||||||
| Research and development |
179,426 | 107,368 | 72,058 | 67.11 | % | |||||||||||
| Selling, general, and administrative |
38,693 | 25,591 | 13,102 | 51.20 | % | |||||||||||
| |
|
|
|
|
|
|
|
|||||||||
| Loss from operations |
(218,119 | ) | (113,518 | ) | (104,601 | ) | 92.14 | % | ||||||||
| |
|
|
|
|
|
|
|
|||||||||
| Other income (expense): |
||||||||||||||||
| Interest income |
3,717 | 11,701 | (7,984 | ) | (68.23 | )% | ||||||||||
| Other expense |
(45 | ) | (31 | ) | (14 | ) | 48.25 | % | ||||||||
| |
|
|
|
|
|
|
|
|||||||||
| Loss before income taxes |
(214,447 | ) | (101,848 | ) | (112,599 | ) | 110.56 | % | ||||||||
| Income tax expense (benefit) |
2 | (7,771 | ) | 7,773 | (100.13 | )% | ||||||||||
| |
|
|
|
|
|
|
|
|||||||||
| Net loss |
$ | (214,449 | ) | $ | (94,077 | ) | $ | (120,372 | ) | 127.95 | % | |||||
| |
|
|
|
|
|
|
|
|||||||||
-64-
Revenue
Development and services revenue decreased by $19.6 million in 2020 to $0 in 2020 from $19.6 million from 2019. In 2019, we had nonrecurring development and service contracts which resulted in the generation of $19.6 million in revenue that did not reoccur in 2020.
Research and Development
Research and development increased by $72.1 million in 2020, or 67.1%, to $179.4 million in 2020 from $107.4 million in 2019, primarily driven by an increase in headcount from continued hiring to effectively scale the growth of our business. Payroll costs related to research and development increased
$49.2 million, non-payroll hardware
development costs increased $12.7 million, and non-payroll software
development costs increased $7.8 million. Selling, General and Administrative
Selling, general, and administrative expense increased by $13.1 million in 2020, or 51.2%, to $38.7 million in 2020 from $25.6 million in 2019, primarily driven by an increase in headcount from both acquisitions and from continued hiring to effectively support the growth of our business. This change is primarily driven by an increase in payroll costs of $8.5 million, and an increase in professional services costs of $4.2 million.
Interest Income
Interest income decreased by $7.9 million in 2020, or 68.2%, to $3.7 million in 2020 from $11.7 million in 2019, primarily driven by a decrease in the balance of short-term investments of $349.9 million. Income tax expense (benefit) changed to an income tax expense of $0.1 million in 2020 from an income tax benefit of $7.8 million in 2019, primarily due to 2019 including the release of a deferred tax asset valuation allowance as a result of deferred tax liabilities incurred from the acquisition of Blackmore.
Income Tax Expense (Benefit)
Net Income (Loss)
Net loss increased $120.4 million to $214.4 million in 2020, from $94.1 million in 2019, for the reasons discussed above.
Liquidity and Capital Resources
On November 3, 2021 we consummated the Merger, resulting in us receiving net cash proceeds of $1.1 billion, net of transaction costs of $0.1 billion.
We have financed our operations primarily through the sale of redeemable convertible preferred stock, which has historically been sufficient to meet our working capital and capital expenditure requirements. As of June 30, 2021, our principal sources of liquidity were $784.8 million of cash and cash equivalents, exclusive of short-term restricted cash of approximately $0.2 million and long-term restricted cash of approximately $13.3 million. Cash and cash equivalents consist primarily of money market funds.
In 2019, Legacy Aurora sold 69,146,470 shares of Series B redeemable convertible preferred stock at $9.2403 per share for net proceeds of approximately $634.0 million, before taking into account repurchases of 17,290 and 57,620 shares of Series B redeemable convertible preferred stock at $9.2403 per share in 2019 and 2020, respectively. Legacy Aurora did not issue any redeemable convertible preferred stock in 2020. In 2021, Legacy Aurora sold 20,349,230 shares of Aurora’s
Series U-2 redeemable
convertible preferred stock at $19.66 per share for net proceeds of approximately $397.9 million. Legacy Aurora has incurred negative cash flows from operating activities and significant losses from operations in the past as reflected in our accumulated deficit -65-
of $706.2 million as of June 30, 2021. We expect to continue to incur operating losses at least for the next 12 months due to the investments that we intend to make in our business and, as a result, we may require additional capital resources to grow our business. We believe our cash on hand together with the proceeds from our sale of redeemable convertible preferred stock and the cash proceeds from the Business Combination and the related private placement will be sufficient to meet our working capital and capital expenditure requirements for a period of at least twelve months from the date of this prospectus.
We may need additional funding due to changing business conditions or other developments, including unanticipated regulatory developments and competitive pressures. Our future capital requirements will depend on several factors, including but not limited to, the rate of our growth, our ability to attract and retain customers and partnerships and their willingness to pay for our services, and the timing and extent of spending to support our efforts to develop our Aurora Driver. Further, we may enter into future arrangements to acquire or invest in businesses, products, services, strategic partnerships, and technologies. To the extent that our current resources are insufficient to satisfy our cash requirements, we may need to seek additional equity or debt financing. If the needed financing is not available, or if the terms of financing are less desirable than we expect, we may be forced to scale back our existing operations, which could have an adverse impact on our business and financial prospects.
Cash Flows
The following table summarizes our cash flows for the periods indicated (in thousands):
Six Months ended June 30, |
||||||||
2021 |
2020 |
|||||||
| (in thousands) |
||||||||
| Net cash used in operating activities |
$ | (282,952 | ) | $ | (75,643 | ) | ||
| Net cash provided by investing activities |
281,311 | 178,679 | ||||||
| Net cash provided by financing activities |
400,108 | 557 | ||||||
| Net increase in cash |
398,467 | 103,593 | ||||||
| Cash, beginning of period |
399,828 | 246,972 | ||||||
| |
|
|
|
|||||
| Cash, end of period |
$ | 798,295 | $ | 350,565 | ||||
| |
|
|
|
|||||
Cash Flows Used in Operating Activities
Net cash used in operating activities increased by $207.3 million from June 30, 2020 to June 30, 2021 due to increases in spending on research and development and selling, general, and administrative expenses, primarily driven by increases in payroll related expenses due to an increase in headcount.
Net cash used in operating activities is $283.0 million for the six months ended June 30, 2021, primarily related to normal cash operating expenses, including research and development and selling, general and administrative expenses. Changes in operating assets and liabilities decreased cash flows from operations by $17.5 million, primarily due to decreases in accrued expenses and other current
and non-current
liabilities of $48.5 million and operating lease liabilities of $14.6 million partially offset by a $50.0 million deposit liability. Net cash used in operating activities of $75.6 million for the six months ended June 30, 2020, primarily related to normal cash operating expenses, including research and development and selling, general and administrative expenses.
Cash Flows Provided by Investing Activities
Net cash provided by investing activities increased by $102.6 million from June 30, 2020 to June 30, 2021, primarily due to net cash acquired in the purchase of businesses of $294.4 million, offset by a decrease in the net cash provided from maturities and purchases of short-term investments of $179.9 million.
-66-
Net cash provided by investing activities is $281.3 million for the six months ended June 30, 2021, due to net cash acquired in the purchase of businesses of $294.4 million partially offset by $13.1 million in purchases of property and equipment.
Net cash provided by investing activities is $178.7 million for the six months ended June 30, 2020, primarily due to maturities of short-term investments of $300.0 million partially offset by purchases of short-term investments of $120.1 million.
Cash Flows Provided by Financing Activities
Net cash provided by financing activities increased by $399.6 million from June 30, 2020 to June 30, 2021, due to net proceeds from the issuance of
Series U-2 preferred
stock of $397.9 million during 2021. Net cash provided by financing activities is $400.1 million for the six months ended June 30, 2021, primarily due to net proceeds from the issuance of
Series U-2 preferred
stock of $397.9 million. Net cash provided by financing activities is $0.6 million for the six months ended June 30, 2020, due to proceeds from the issuance of common stock of $0.6 million. The following table summarizes our cash flows for the periods indicated (in thousands):
Years ended December 31, |
||||||||
2020 |
2019 |
|||||||
| (in thousands) |
||||||||
| Net cash used in operating activities |
$ | (191,879 | ) | $ | (94,726 | ) | ||
| Net cash provided by (used in) investing activities |
343,289 | (372,534 | ) | |||||
| Net cash provided by financing activities |
1,446 | 634,702 | ||||||
| Net increase in cash |
152,856 | 167,442 | ||||||
| Cash, beginning of period |
246,972 | 79,530 | ||||||
| |
|
|
|
|||||
| Cash, end of period |
$ | 399,828 | $ | 246,972 | ||||
| |
|
|
|
|||||
Cash Flows Used in Operating Activities
Net cash used in operating activities increased by $97.2 million from the year ended December 31, 2019 to the year ended December 31, 2020 due to a decrease in collections from contracts with customers given the completion of development service contracts and increases in spending on research and development and selling, general, and administrative expenses, primarily driven by increases in payroll related expenses due to an increase in headcount.
Net cash used in operating activities is $191.9 million for the year-ended December 31, 2020, was primarily related to normal cash operating expenses, including research and development and selling, general and administrative expenses. Changes in operating assets and liabilities decreased cash flows from operations by $11.4 million, primarily due to an increase in prepaid expenses and other current assets and in other assets of $11.7 million and $14.0 million, respectively. The decrease from changes in operating assets and liabilities was partially offset by an increase in accrued expenses and other current
and non-current liabilities
of $13.7 million. Net cash used in operating activities of $94.7 million for the year-ended December 31, 2019, was primarily related to normal cash operating expenses, including research and development and selling, general and administrative expenses. Changes in operating assets and liabilities decreased cash flows from operations by $23.0 million, primarily due to a decrease in deferred revenue of $16.6 million, a decrease in operating lease liability of $3.5 million, and an increase in prepaid expenses and other current assets of $6.3 million. The decrease from changes in operating assets and liabilities was partially offset by a decrease in accounts receivable of $3.3 million and an increase in accrued expenses and other current
and non-current liabilities
of $1.4 million. -67-
Cash Flows Provided by (Used in) Investing Activities
Net cash provided by investing activities increased by $715.8 million from the year ended December 31, 2019 to the year ended December 31, 2020, due to a decrease of $625.5 million in the purchases of short-term investments, a $70.0 million increase in the maturities of short-term investments, and a decrease in acquisition activity of $23.1 million.
Net cash provided by investing activities is $343.3 million for the year-ended December 31, 2020, primarily due to maturities of short-term investments of $470.0 million, partially offset by purchases of short-term investments of $120.0 million.
Net cash used in investing activities is $372.5 million for the year-ended December 31, 2019, primarily due to purchases of short-term investments of $745.6 million and purchase of business, net of cash acquired, of $23.1 million, partially offset by maturities of short-term investments of $400.0 million.
Cash Flows Provided by Financing Activities
Net cash provided by financing activities decreased by $633.3 million from December 31, 2019 to December 31, 2020, due to net proceeds from the issuance of Series B preferred stock of $634.0 million in 2019.
Net cash provided by investing activities is $1.4 million for the year-ended December 31, 2020, primarily due to proceeds from the issuance of common stock of $2.7 million, partially offset by payments to repurchase Series B preferred stock of $0.5 million and payments to repurchase unvested early exercised stock options of $0.8 million.
Net cash provided by financing activities is $634.7 million for the year-ended December 31, 2019, primarily due to net proceeds from the issuance of Series B preferred stock of $634.0 million.
Contractual Obligations, Commitments and Contingencies
We may be party to various claims within the normal course of business. Legal fees and other costs associated with such actions are expensed as incurred. We assess the need to record a liability for litigation and other loss contingencies, with reserve estimates recorded if we determine that a loss related to the matter is both probable and reasonably estimable. We did not record any material losses for 2019 or 2020.
Our future contractual commitments related to future minimum payments for purchase obligations at June 30, 2021 are $8.2 million in 2021, $27.8 million in 2022, $2.3 million in 2023, and $0.5 million in 2024. Our future contractual commitments related to future minimum payments
under non-cancelable operating
leases at June 30, 2021 are $10.6 million in 2021, $21.9 million in 2022, $20.2 million in 2023, $19.6 million in 2024, $17.9 million in 2025, and $76.8 million thereafter. Our future contractual commitments related to future minimum payments for purchase obligations at December 31, 2020 are $16.5 million in 2021, $26.6 million in 2022, and $0.8 million in 2023. Our future contractual commitments related to future minimum payments
under non-cancelable operating
leases at December 31, 2020 are $14.0 million in 2021, $15.1 million in 2022, $14.6 million in 2023, $14.4 million in 2024, $14.6 million in 2025, and $68.1 million thereafter. Critical Accounting Estimates
Our consolidated financial statements have been prepared in accordance with GAAP. Preparation of the financial statements requires our management to make judgments, estimates and assumptions that impact the reported amount of net sales and expenses, assets and liabilities and the disclosure of contingent assets and
-68-
liabilities. We consider an accounting judgment, estimate or assumption to be critical when (1) the estimate or assumption is complex in nature or requires a high degree of judgment and (2) the use of different judgments, estimates and assumptions could have a material impact on our consolidated financial statements. Our significant accounting policies are described in Note 2 to our audited consolidated financial statements included elsewhere in this prospectus. Our critical accounting policies are described below.
Stock-Based Compensation
We measure and records the cost of stock-based awards granted to its employees and directors based on the estimated grant-date fair value of the awards. Cost is recognized on a straight-line basis over the requisite service period, which is generally the vesting period of the award. We have elected to recognize the effect of forfeitures in the period they occur. We determine the fair value of stock options using the Black-Scholes-Merton option pricing model, which is impacted by the following assumptions:
| • | Expected Term |
| • | Expected Volatility |
| • | Expected Dividend Yield |
| • | Risk-Free Interest Rate Treasury zero-coupon issues with an equivalent remaining term equal to the expected life of the award. |
The grant date fair value of Legacy Aurora common stock was determined with the assistance of an independent third-party valuation specialist. The grant date fair value of Legacy Aurora common stock was determined using valuation methodologies which utilizes certain assumptions, including probability weighting of events, volatility, time to liquidation, a risk-free interest rate, and an assumption for a discount for lack of marketability (Level 3 inputs). Based on Aurora’s early stage of development and other relevant factors, it determined that an Option Pricing Model (“OPM”) was the most appropriate method for allocating its enterprise value to determine the estimated fair value of Legacy Aurora common stock. We have historically used the OPM back solve analysis to estimate the fair value of Legacy Aurora common stock, which derives the implied equity value for one type of equity security from a contemporaneous transaction involving another type of security, shares of our convertible preferred stock in this instance. We will no longer use the estimates utilized in determining the grant date fair value for new awards because our shares are now publicly traded.
Business Combinations
We allocate the fair value of the purchase consideration to the tangible assets acquired, liabilities assumed, and intangible assets acquired based on their estimated fair values. The excess of the fair value of purchase consideration over the fair values of these identifiable assets and liabilities is recorded as goodwill. Such valuations require management to make significant estimates and assumptions, especially with respect to intangible assets. Significant estimates and assumptions in valuing certain intangible assets include, but are not limited to, estimated replacement cost, profit margin, opportunity cost, useful lives, and discount rates. Management’s estimates of fair value are based upon assumptions believed to be reasonable, but which are inherently uncertain and unpredictable and, as a result, actual results may differ from estimates. During the measurement period, we may record adjustments to the assets acquired and liabilities assumed, with the corresponding offset to goodwill. Upon the conclusion of the measurement period, any subsequent adjustments are recorded to earnings.
-69-
Valuation of Intangible Assets
Intangible assets with indefinite lives consist
of in-process research
and development (“IPR&D”). We test these assets for potential impairment annually as of December 31 of each fiscal year. These assets are tested annually for impairment until completion. The process of evaluating the potential impairment of these assets involve significant judgment regarding estimates of the future cash flows associated with each asset. No intangible asset impairments were recorded during the years ended December 31, 2019 or 2020.
Recently Adopted and Issued Accounting Pronouncements
See Note 2 to our financial statements included elsewhere in this prospectus for recently adopted accounting pronouncements and recently issued accounting pronouncements not yet adopted as of the date of this prospectus.
Emerging Growth Company Accounting Election
Section 102(b)(1) of the JOBS Act exempts emerging growth companies from being required to comply with new or revised financial accounting standards until private companies are required to comply with the new or revised financial accounting standards. The JOBS Act provides that a company can elect not to take advantage of the extended transition period and comply with the requirements that apply
to non-emerging growth
companies, and any such election to not take advantage of the extended transition period is irrevocable. RTPY is an “emerging growth company” as defined in Section 2(a) of the Securities Act of 1933, as amended, and has elected to take advantage of the benefits of this extended transition period. We expect to remain an emerging growth company at least through the end of 2021 and will have the benefit of the extended transition period. This may make it difficult to compare our financial results with the financial results of other public companies that are either not emerging growth companies or emerging growth companies that have chosen not to take advantage of the extended transition period. Quantitative and Qualitative Disclosures About Market Risk
We are exposed to a variety of market and other risks, including the effects of changes in interest rates, and inflation, as well as risks to the availability of funding sources, hazard events, and specific asset risks.
Interest Rate Risk
Our results of operations are directly exposed to changes in interest rates, among other macroeconomic conditions. Interest rate risk is highly sensitive to many factors, including governmental monetary and tax policies, domestic and international economic and political considerations, and other factors beyond our control.
We do not believe that an increase or decrease in interest rates
of 100-basis points
would have a material effect on our business, financial condition or results of operations. Fluctuations in the value of our money market funds caused by a change in interest rates (gains or losses on the carrying value) are recorded in other income and are realized only if we sell the underlying securities. -70-
BUSINESS
Unless the context otherwise requires, all references in this section to the “Company,” “we,” “us,” or “our” refer to the business of Aurora Innovation, Inc. and its subsidiaries.
Company Overview
Our mission is to deliver the benefits of self-driving technology safely, quickly, and broadly.
Aurora was founded in 2017 by Chris Urmson, Sterling Anderson, and Drew Bagnell, three of the most prominent leaders in the self-driving space. Led by a team with deep experience, we are developing the Aurora Driver based on what we believe to be the most advanced and scalable suite of self-driving hardware, software, and data services in the world to fundamentally transform the global transportation market. The Aurora Driver is designed as a platform to adapt and interoperate amongst a multitude of vehicle types and applications. As of September 30, 2021, it has been successfully integrated into eight different vehicle platforms designed to meet its requirements: from passenger vehicles to light commercial vehicles to Class 8 trucks. By creating a common driver platform for multiple vehicle types and use cases, the capabilities we develop in one market reinforce and strengthen our competitive advantages in other areas. For example, the capabilities needed for a truck to move safely at highway speeds would also be critical in ride hailing when driving a passenger to the airport via a highway. We believe this is the right approach to bring self-driving to market and will enable us to capitalize on a massive opportunity, including the $4 trillion global trucking market, the $5 trillion passenger mobility market, and the $400 billion local goods delivery market.
Beyond the economic opportunity, we believe we have a unique opportunity to affect a material positive impact on the lives of millions of people, while also improving business productivity. First and foremost, we are focused on the opportunity to greatly improve road safety. Every year more than a million people lose their lives on the world’s roads, and we believe we can meaningfully reduce this number. In trucking, we can enable logistics networks to move goods more efficiently, and also help fill the shortage of 60,000 truck drivers as of 2018 by providing a self-driving option.
We will expand access to transportation, improving the lives of approximately 25.5 million people with a disability in the U.S. who have difficulty traveling outside of the home. And we will give people back their time; the average driver spends the equivalent of 10 days a year commuting—time that can be made more productive and enjoyable.
We intend to launch trucking as our first driverless product, as we believe its massive scale, significant structural need, attractive unit economics, and self-similar operating environment will allow us to rapidly deploy and profitably scale on high-volume, highway-focused routes. Drafting on the revenue and technical capability we expect this trucking product to generate, we plan to leverage the extensibility of the Aurora Driver to deploy and scale into the passenger mobility and local goods delivery markets. Today, we operate our self-driving test vehicle fleet in diverse weather and operating environments, across the Bay Area, Pittsburgh and Texas, allowing us to create a more robust self-driving system. We also carry truck freight on behalf of our partners in preparation for driverless commercialization.
Our first-principles approach, which we define as “Self-Driving 2.0,” underpins our technology development strategy for the Aurora Driver. We made foundational investments early on, based on our prior experience in the self-driving industry, that allow us to accelerate development and position our platform for long-term scalability. Some of these foundational investments include developing the Aurora Driver with what we believe to be the optimal combination of machine-learned and rule-based approaches. We have also built a proprietary Virtual Testing Suite, which makes our development more efficient and faster than traditional approaches that rely heavily
on on-road
vehicle fleets. While many companies in the self-driving industry tout miles driven as a metric, our Virtual Testing Suite allows us to iterate faster and more efficiently, while reducing our reliance on on-road testing.
-71-
We have also invested in our next-generation sensing suite, which combines the best of camera, radar, and lidar. This includes developing our Aurora FirstLight Lidar, which uses proprietary frequency modulated continuous wave (“FMCW”) technology that enables long-range sensing, and simultaneous detection of both the position and velocity of objects. We believe that when combined with our industry-leading sensor suite and perception system, this technology uniquely enables safe operation at highway speeds and is unmatched by our competitors’ alternative solutions.
We believe this unlocks the $4 trillion global trucking market, as trucks must be capable of operating at up to 65 miles per hour and 80,000 pounds gross vehicle weight, necessitating long-range sensing in order to plan and take action appropriately. High-speed operation is also key to unlocking the full opportunity set across passenger mobility and local goods delivery, where a significant percentage of trips require operation on highways and other high-speed roads.
redundant
To bring our product to market at scale, we focus on what we do best—building self-driving technology—and through strategic partnerships work companies to deliver the benefits of our technology broadly. We have strategic partnerships with:
with best-in-class
| • | PACCAR & Volvo, who together represent nearly 50% of US Class 8 truck sales. |
| • | Toyota, the #1 passenger vehicle manufacturer by volume globally. |
| • | Uber, the largest ride hailing company globally. |
With these strategic partnerships, each party is making significant investments towards integrating the Aurora Driver into their vehicles and logistics and mobility networks. We believe that partnering with other industry leaders enables us to scale more efficiently, as it allows us to focus on what we do best—developing the Aurora Driver—while our partners handle activities such as vehicle manufacturing, fleet ownership, and operation. We are proud that these industry leaders have selected Aurora as their self-driving partner.
To deliver our product, we plan to offer a Driver as a Service business model, whereby partners can subscribe on a per mile basis. While we will supply self-driving technology, we do not intend to own nor operate large vehicle fleets ourselves. We will partner with automotive companies, fleet operators, and other third parties to commercialize and support Aurora-powered vehicles. We expect this Driver as a Service model to enable an asset-light and high-margin revenue stream for Aurora, while allowing us to scale more rapidly through partnerships.
As of September 30, 2021, we have assembled an
approximately 1,600-person
team, consisting of leading experts in robotics, machine learning, hardware design, software engineering, systems engineering, and safety. We believe that our combined experience and expertise allow us to move faster and more efficiently than our competitors as we make purposeful, foundational technological investments in safe and scalable self-driving technology. The Self-Driving Industry
The concept of self-driving vehicles has captured the human imagination for nearly a century. Early demonstrations, led by academics and industry experts, have shown both the promise of this technology as well as the difficulty of its development. These scattered efforts were jump started in the early 2000s when the Defense Advanced Research Projects Agency (DARPA) sponsored a series of open competitions to focus and accelerate the efforts of various research groups. Aurora’s Founder and Chief Executive Officer, Chris Urmson was the technical director for the Carnegie Mellon University team that progressed furthest in the first DARPA competition in 2004 and won the
final, 60-mile
long urban driving challenge in 2007. Since that time, major automotive and technology companies, as well as promising startups, have invested heavily in this technology. As a result, the industry has experienced rapid improvement in a multitude of areas
-72-
including sensor range and accuracy, computing and processing capacity, machine learning techniques, vehicle integration, and safety redundancy.
Levels of Automation
To measure the scope of these systems, the Society of Automotive Engineers (SAE) has defined six levels of automation, from no automation (Level 0) to full automation (Level 5).
Advanced driver assistance (ADAS) technologies, which are reliant on human oversight and intervention, are classified as Level 1 and Level 2 automation.
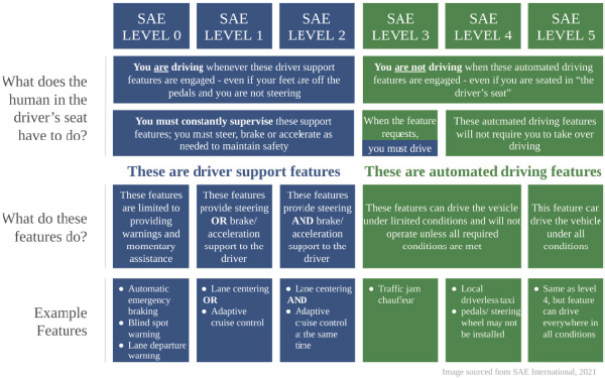
Aurora’s technology is designed to deliver fully autonomous driving without the need for human intervention. This is classified as Level 4—High Automation, with the vehicle capable of performing all driving functions under certain conditions, such as specific road types and weather. This set of conditions is referred to as the system’s “operating domain.” We believe that, because a driver is no longer required inside the vehicle, this level of automation allows for step-change benefits in both safety and efficiency and opens massive commercial opportunities.
Benefits of Automation
Key benefits of vehicle automation include:
| • | Improved safety |
-73-
| • | Faster, more efficient goods movement |
| • | More reliable freight supply |
| • | Reduced Insurance Expenses |
| • | Enhanced Energy Efficiency |
| • | Increased access to passenger mobility . |
| • | Greater individual productivity . |
Market Opportunity
Vehicles drove over miles in the United States in 2019. This represents a massive potential market opportunity for self-driving technology. We estimate that our core markets of trucking, passenger mobility, and local goods delivery currently generate $2 trillion of revenue in the United States, and over $9 trillion globally.
3.2 trillion
As a fully integrated L4 autonomous driving system, we believe the Aurora Driver will be uniquely positioned to capture market share and play a critical role in the evolving autonomous vehicle ecosystem. With one driver system for multiple vehicle types, we believe our capabilities in one market will reinforce our competitive advantages in another. We expect that the Aurora Driver will become a foundational technology that has the potential to generate revenue across new and emerging applications.
-74-
Trucking Market
Our first product is focused on the US trucking industry, which generated over $700 billion in revenue and 300 billion vehicle miles traveled in the US in 2019. Trucking is a critical part of the United States economy, responsible for moving 65% of goods. Globally, we estimate that trucking is a $4 trillion industry. The trucking industry faces a number of ongoing challenges that the Aurora Driver can help solve. The industry has experienced a persistent driver shortage, resulting in high driver turnover. Growth in ecommerce increases customer expectations for same- or
next-day
delivery, while service restrictions on driver operating hours create inherent limitations to optimally fast and responsive supply chains. These constraints increase the cost to transport goods and create supply chain inefficiencies. By enabling greater efficiency, autonomous trucks can have a significant positive impact. For these reasons, the US Department of Transportation has recently stated that autonomous trucking has the potential to add over $68 billion to US GDP. Passenger Mobility Market
Our second core market focuses on passenger mobility, initially targeting the ride hailing space. Based on public filings, we estimate that the U.S. ride-hailing market was a $35 billion market in 2019, growing at more than 10% annually. Beyond ride-hailing, the broader passenger mobility market includes nearly 2 trillion vehicle miles driven by personally owned light-duty vehicles in urbanized areas. According to the Bureau of Transportation Statistics, the U.S. passenger mobility market is in excess of $1 trillion. Alongside health, housing, and food, transportation is one of the largest segments of U.S. household spending. Globally, we estimate that passenger mobility represents a $5 trillion market.
As it exists today, however, passenger mobility is subject to inefficiencies and responsible for notable negative impacts—roadway deaths, lost productivity, and greenhouse gas emissions. These are all challenges that self-driving technology has the potential to help alleviate. We believe that the Aurora Driver can provide a safer alternative to manually-driven transport, return numerous hours that would otherwise have been spent driving, and expedite the transition to electric vehicles.
We believe technological advancements in ride-hailing and lower structural costs, enabled by self-driving technology, will expand ride-hailing into more passenger mobility use cases and drive mass adoption, further democratizing access to mobility. We aim to improve the rider experience through the quality, cleanliness, and consistency of the Aurora Driver-powered fleet while also offering more rider control over the in-vehicle experience (e.g. music, climate). Future vehicle platforms may be designed to support specific transportation use cases (e.g. airport trips, commutes, social rides) that further improve the experience offered today.
Local Goods Delivery Market
Our third core market is local goods delivery, which we estimate to be a $100 billion market in the United States and $400 billion globally, growing at more than 10% annually, based on public filings and industry reports. This market spans several (B2B) delivery.
sub-segments,
including last-mile parcel and post, prepared food, grocery, and business-to-business
The COVID-19 pandemic has highlighted the importance of local goods delivery, as well as the supply chain disruptions that can be experienced when consumer behavior changes abruptly. We expect consumer demand for online shopping and
on-demand
ordering will largely remain in place following the COVID-19
pandemic and that retailers, restaurants, and other local businesses will seek to address these preferences through expanded delivery channels. Self-driving technology can provide meaningful value in making e-commerce
and on-demand
purchases more affordable for consumers and more accessible to businesses. Relative to trucking and passenger mobility, we believe local goods delivery has more advanced technical complexity given active problem-solving related to identifying appropriate drop-off locations and completion of
-75-
the “last 50 feet” of goods delivery from vehicle to door. We expect that the Aurora Driver will be uniquely positioned to serve this market based on reinforcing competitive advantages and technical gains from trucking and ride hailing.
Why Aurora is Positioned to Win
Industry leading team.
Aurora was founded in 2017 by Chris Urmson, Sterling Anderson, and Drew Bagnell, three leaders in the self-driving space. Chris led the Google self-driving car team and was technology director for Carnegie Mellon when it won the 2007 DARPA Urban Challenge; Sterling developed MIT’s Intelligent CoPilot, then launched Tesla’s Model X and Autopilot; Drew worked for two decades at the intersection of machine learning and robotics across industry and academia at Carnegie Mellon. As of September 30, 2021, Aurora has assembled an approximately
1,600-person
team, of whom approximately 1,400 focus on engineering and product. Our company consists of world-leaders in robotics, machine learning, hardware design, software engineering, systems engineering, and safety. Aurora has over 1,100 awarded and pending patents worldwide and our team has more than 175 PhDs. In 2021, Aurora acquired and integrated Uber’s self-driving unit, strengthening our team, our technology, and our intellectual property. The acquisition added to the breadth and depth of talent we have to deliver on our mission. We foster a high-performance and mission-driven culture which drives successful execution, and we believe this makes us an employer of choice in our industry. Next-generation technology
Unencumbered by legacy technology and methods, we have taken a clean sheet approach to creating a safe and scalable self-driving system. We have invested in key areas of differentiation that we believe provide a long-term advantage, including:
| • | Careful integration of machine learning and engineering approaches throughout our perception and motion planning systems |
| • | Virtual Testing Suite that allows for accelerated and efficient development |
| • | Differentiated long-range, high-resolution, multi-modal sensor suite that includes FirstLight Lidar technology, which allows numerous advantages over traditional lidar, including the ability to unlock safe operation at highway speeds |
| • | Scalable maps that are maximally relevant to the challenges of self-driving |
Common driver platform technology, scalable across vehicle types and use cases
The Aurora Driver is built on a common architecture that is designed to adapt readily to the vehicle platform it controls. This allows the Aurora Driver to learn from and leverage its experience and capabilities across a wide range of vehicle makes and models. We invested early in our hardware suite to minimize reliance on any one vehicle platform, allowing greater optionality in both the types of vehicles we use as well as their commercial applications.
Differentiated strategy
go-to-market
Our technology enables us to first target trucking, which we believe is the optimal way to enter the market and scale self-driving technology. Because of the extensibility of the Aurora Driver across vehicle types and use cases, we are able to take advantage of capability overlap across use cases, increased learning with scale, and cost reductions in our self-driving system. Therefore, the capabilities and scale we develop in trucking accelerate our expansion into passenger mobility and local goods delivery, and vice versa.
-76-
Deep strategic partnerships which support commercialization at scale
We have developed strategic partnerships with industry leaders like PACCAR, Volvo, Toyota and Uber and will work together to develop and scale Aurora Driver-powered trucks and self-driving passenger vehicles. Our partners are industry leaders in their respective fields and we are able to leverage each of our respective strengths as we commercialize. This allows us to scale faster and more efficiently. With PACCAR and Volvo, we are partnered with OEMs holding almost 50% of the US truck market; with Toyota, we are partnered with the number one passenger car OEM in the world; and with Uber, we are partnered with the number one ride hailing company in the world. We believe partnerships like these will be important in being able to bring a safe, scalable solution to market quickly.
Efficiency of development and operation
We believe that our approach to technological development, coupled with our Driver as a Service business model, enables us to develop and scale our technology efficiently. This is further enhanced by our collaboration with Uber, which allows us access to proprietary anonymized data related to trip demand and economics. This data allows us to optimize our development roadmap to invest in the highest value markets and capabilities.
Mission-driven corporate culture.
From the beginning, we have invested in building a mission-driven company based on a set of values that drive who we are and how we operate. A strong, inclusive, and effective culture is fundamental for the long-term success of a business, and even more so when delivering a technology as complex and transformative as self-driving. We are building an enduring company and our culture and values represent an advantage in delivering and scaling our product.
Our Product
The Aurora Driver
We are building the Aurora Driver—the hardware, software, and services to enable safe, cost-efficient, and high-uptime autonomous driving service. The Aurora Driver is based on a common driver platform design that can integrate with vehicles of various makes, models, and classes to serve multiple commercial applications.
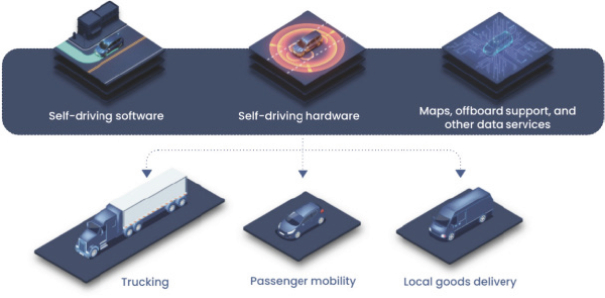
-77-
Aurora’s custom-designed hardware suite includes full sensor coverage on three sensing modalities: lidar, radar, and camera, as well as high-performance computing to enable rapid response time. The computer powers Aurora’s self-driving software, which plans a safe path of motion for the vehicle in order to reach its destination.
The Aurora Driver has been designed to be consistent and transferable across different vehicle types, be it a sedan, a van, or a Class 8 truck. This includes purposeful design choices including a hardware suite that is consistent across vehicle types, software that adapts to the unique dynamics of the vehicle it controls, and a system interface over a single umbilical.
As of September 30, 2021, the Aurora Driver had been successfully integrated across eight different vehicle platforms. The commercial self-driving vehicles that integrate with the Aurora Driver will include redundant steering, braking, and power to promote safe vehicle operation in the event of a component failure. We work closely with our OEM partners to develop a safe, reliable, and scalable integrated solution.
Unique Driver as a Service Business Model
The Aurora Driver will be delivered as a service. We intend to partner with our ecosystem of OEMs, fleet operators, and mobility and logistics services, as well as other third parties, to commercialize and support Aurora-powered vehicles. With our business model, fleet owners will purchase Aurora Driver-powered vehicles from our OEM partners, subscribe to the Aurora Driver, and utilize Aurora-certified fleet service partners to operate autonomous mobility and logistics services. In many instances, the same party may play multiple roles: for example, our OEM partners will in certain cases also provide maintenance services and act as a fleet operator.
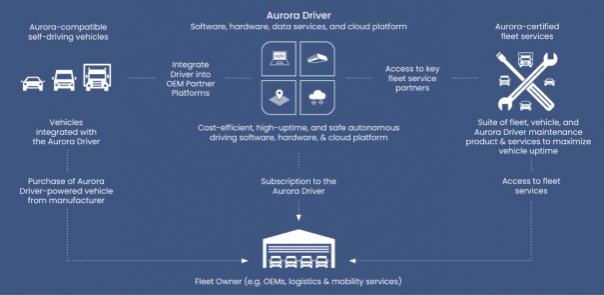
By subscribing to the Aurora Driver, our customers will be able to receive access to the following:
| 1. | Aurora Driver hardware and software to enable safe and efficient autonomous operation of the self-driving fleet; |
| 2. | Updates to the Aurora Driver, including map and software updates; |
| 3. | Access to the Aurora Cloud platform, which will interface with their systems and enable efficient dispatch, deployment, and fleet monitoring; |
| 4. | Teleassistance support, where trained specialists monitor Aurora Driver-powered vehicles and provide high level guidance when needed; and |
-78-
| 5. | Access to Aurora-certified third party services, including maintenance of the Aurora Driver, roadside assistance for the Aurora Driver, and insurance. |
Components of the offering such as maintenance, hardware financing, and insurance, will be delivered in partnership with our third-party partner network. We believe that this business model uniquely allows us to scale in a high margin way, and succeed as our customers succeed.
Technology
How Self-Driving Technology Works
Self-driving vehicles combine a variety of incoming information streams in order to achieve their objective: safely moving from one location to another. The below is a high-level diagram of key elements of our self-driving system:
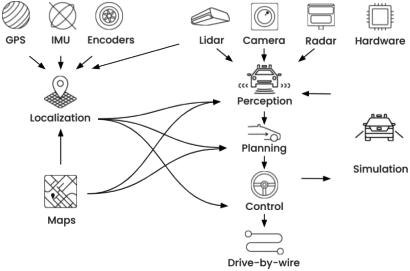
High-definition maps are a detailed three-dimensional representation of the world, which simplifies the driving task by providing known information about the environment. This helps the vehicle contextualize the world and understand the rules of the road.
Localization is the process of determining the vehicle’s location in the map frame. Localization leverages inputs from Maps and reconciles it against sensor data, allowing the vehicle to determine its location in the world, which is in turn passed on to various software modules within the autonomy stack.
The Perception software module combines incoming sensor data from lidar, cameras, and radar to determine what other vehicles and roadway actors are present in a given scene and key attributes of their motion. Each type of sensor has different—and complementary—strengths and weaknesses:
| • | Cameras can see color and far distance (under certain circumstances), but struggle in low-light and very high dynamic range situations. They also cannot directly measure how far away a given object is. |
| • | Radar provides range and radial velocity sensing, including in inclement weather, but at lower resolution than other sensors. |
| • | Lidar allows for high resolution range sensing in all lighting conditions, but misses certain appearance information like color and texture. |
-79-
We believe that it is critical to employ multiple types of sensing that can see at a certain range. This ensures more reliable performance and enhanced safety, particularly in those environments where one sensor type may underperform, for example, cameras in low light or fog.
The Planning system makes an assessment of the best course of action given the current and projected state of the world and other actors. The Planning system output is a trajectory for the vehicle to follow.
This trajectory is passed through the Control module, which generates appropriate throttle, brake, and steering signals. These throttle, brake, and steering commands are passed over the vehicle platform’s system for actuation.
drive-by-wire
Our Technological Advantages
Since our inception, Aurora has taken a clean sheet approach to the way we build our technology, leveraging our team’s past experience and learnings. We have made purposeful, foundational technological investments that we believe will enable us to move towards meaningful commercialization more safely, quickly, and broadly. Examples of this ‘self-driving 2.0’ approach, across both hardware & software, include:
| 1. | Proprietary lidar technology to unlock highway speeds; |
| 2. | Next-generation approach to Perception and Planning that leverages the distinct strengths of both machine learning and engineered approaches; |
| 3. | Common driver platform approach which allows our system to scale onto different vehicle types, such as cars and Class 8 trucks; |
| 4. | Aurora’s Virtual Testing Suite, which increases engineering velocity; and |
| 5. | Scalable approach to high-definition maps |
Proprietary Lidar technology
Aurora’s long-range, multi-modal sensing suite consists of high-resolution, high dynamic range and long-range cameras, next-generation imaging radar, and our industry-leading proprietary FirstLight Lidar.
FirstLight alone provides a number of meaningful performance advantages over traditional lidar sensors. Traditional pulsed lidar is amplitude-modulated (AM), which works by emitting brief light pulses at a fixed frequency. The locations of objects are determined based on how long it takes for those laser pulses to bounce off surfaces and return to the sensor. The challenge with AM lidar is that it has limited range, requires multiple measurements to estimate speed, and is susceptible to and solar interference. Aurora’s FirstLight uses frequency-modulated continuous-wave (FMCW) lidar technology. This has a number of key advantages, which we believe are critical to unlocking safe operation at highway speeds:
lidar-to-lidar
| 1. | Greater Range |
| 2. | Simultaneous Range and Velocity |
| 3. | Interference Immunity lidar-to-lidar |
-80-
Leveraging the Best of Machine Learning and Engineered Approaches
Aurora’s approach to designing the Aurora Driver software leverages our team’s expertise in both machine learning and fundamental engineering. Use of either approach for solving a problem has advantages and disadvantages, and therefore the thoughtful fusion of both is critical to creating a safe and scalable system. The key distinctions between machine learning and engineering are that:
| • | Engineered systems are built by humans and tend to be simpler and more introspectable (i.e. can understand ‘why’ an action is taken). |
| • | Machine-learned systems are tuned and developed by algorithms and trained on data. This can allow for greater nuance and complexity, and have the additional advantage that new data can improve overall performance. However, machine-learned systems are less introspectable than engineered systems. |
Aurora’s software teams are selective in their application of each, and frequently bring both to bear on a single task in ways that utilize the independent strengths of each to create a higher-performance system.
An example of this is the Planning system. As the Aurora Driver operates, it uses an engineered approach to maintain appropriate safety buffers—an example is maintaining sufficiently safe following distance, such that the Aurora Driver can stop safely even if the car in front of it brakes aggressively. Using this engineered approach permits strong safety guarantees. However, a system built around such guarantees alone would not drive in a human-like fashion, and may act in such a way that other road users would find it unpredictable. Therefore, we also employ a machine-learned approach where the system learns from exemplary human drivers how to naturally behave during many commonplace interactions, such as merging onto a highway—subject to the buffers defined by the engineered system. Interleaving these two methods allows for the creation of verifiably safe, and natural, driving behavior.
Common Driver Platform Approach
The Aurora Driver has been designed from the ground up to support multiple automakers and commercial applications with the same core hardware and software. Aurora invested early in a hardware suite that is consistent across vehicle platforms, and software that adapts to the unique behaviors, constraints, and dynamics of whatever vehicle it controls—whether that be a Class 8 tractor or light passenger vehicle.
The Aurora Driver uses the same hardware suite across trucks and passenger vehicles. Because all Aurora-Driver powered vehicles carry a common set of self-driving hardware and software, Aurora and its partners benefit from the collective scale of all participants on the platform.
Significant Investments in Virtual Development
Our Virtual Testing Suite is a major engineering accelerator. Virtual testing refers to any time that our system is being tested in response to synthetic or historical data as opposed to operating in real-time on the road. Aurora incorporates frequent and extensive use of virtual testing.
There are numerous benefits to virtual testing:
| • | Efficiency on-road testing. |
| • | Speed |
| • | Safety on-road miles of driving needed to develop the Aurora Driver, which reduces exposure to risk associated with on-road testing. |
| • | Variation |
-81-
| encountered on the road. We can adjust factors like weather, traffic density, or pedestrian behavior. We can quickly test against many thousands of likely variations to understand how the system would have responded. With simulation, we are driving the equivalent of more than 10,000 trips from Dallas to Houston every day. |
| • | Repeatability out-of-date |
Aurora has invested significantly in virtual testing at a time when much of the self-driving industry was focused on real world mileage accumulation. We believe that as the industry reaches the long tail of development, these investments will increasingly accelerate our path to market and scale relative to competitors.
Scalable Approach to High-definition Mapping
Aurora’s approach to mapping aims to optimize for two factors: first, a map that is maximally relevant to the challenges of self-driving; and second, a map that can be maintained at scale.
The Aurora Atlas is a map purpose-designed for these goals. It is broken into smaller maps that cover
sub-areas,
which are referred to as shards. Many classic maps have not been built for self-driving and thus prioritize global positioning accuracy at a substantial detriment to local accuracy. Aurora’s map shards, however, prioritize being locally accurate, as it is far more important that the Aurora Driver knows the location of nearby actors and objects as accurately as possible rather than where it is in some global sense. We do this without sacrificing any meaningful amount of the Aurora Driver’s broader context about where it is in the world or along a route. The sharded, locally consistent approach to the Aurora Atlas enables scalability. Rebuilding the content of a shard takes minutes, whereas for classic maps, these areas can be the size of an entire city and take far longer to adjust. Swapping out a shard in a live deployed map is possible to do rapidly whereas deploying an entirely new map for a city requires a lengthy process. Finally, as the Aurora Driver begins to operate in new areas, the increase in mapped content will not alter existing content or require any
over-the-air,
editing/re-release
of past maps, which a non-sharded
approach would require; this keeps existing operational support much simpler even under a rapid expansion plan. Commercialization Strategy
We plan to commercialize the Aurora Driver safely, quickly, and broadly. Key tenets of our commercialization approach are:
| 1. | Prioritizing our development efforts based on return on investment |
| 2. | Using our common platform approach to scale and drive competitive advantage |
| 3. | Focusing on what we do best |
-82-
| of our OEM, network and logistics partners and allows each party to focus on what they do best as we commercialize and scale our technology. |
| 4. | Building on our trusted reputation |
We are pursuing three massive market opportunities: trucking, passenger mobility, and local goods delivery. Each of these are very large, attractive, and transformative markets.
Trucking
We plan to launch trucking as our first commercial product. We have prioritized this segment as we believe it is an optimal first product for both commercial and technical reasons:
| • | Commercial |
| • | Technical |
We plan to initially launch our driverless trucking product in late 2023 in Texas, which has the largest freight market in the US, a favorable business and regulatory environment, and moderate weather. These characteristics make it an attractive market for our initial driverless launch. From there, we will expand to other key freight corridors.
Passenger Mobility
We plan to launch our driverless passenger mobility product in late 2024. As we use the same Aurora Driver hardware and software as for trucking, we will leverage capabilities already in use by our trucking product. Our ability to drive safely at high speed will allow us to serve the significant fraction of ride-hailing trips that require high speed on interstates and highways.
Local Goods Delivery
We expect the operating domain for local goods delivery to overlap closely with personal mobility and commercial operations of local goods delivery to commence following personal mobility launch.
-83-
Self-reinforcing effects of our business model
We believe that our operation across these three large markets leads to multiple beneficial self-reinforcing effects for our business model:
| 1. | Higher return on development investment |
| 2. | Economies of scale and cost reduction end-market in which we operate. |
| 3. | Learning and data |
| 4. | Reputation |
Our Culture
Aurora’s values guide our work and culture and support our ability to deliver our mission. They set the tone for the way we operate, they define who we are and how we do things, and they guide us when we face difficult situations. Our values are:
| 1. | Operate with integrity |
| 2. | Focus |
| 3. | No jerks |
| 4. | Be reasonable |
| 5. | Set outrageous goals |
| 6. | Win together |
Competition
Our main sources of competition fall into two categories:
| • | Technology-focused companies building end-to-end technical |
| • | Automotive players building internal self-driving development programs |
The principal competitive success factors in our market, in no particular order, include, but are not limited to:
| • | Technology quality, reliability, and safety |
| • | Engineering capabilities |
| • | Business model and go-to-market approach |
-84-
| • | Commercial partnerships |
| • | Cost and efficiency |
| • | Patents and intellectual property portfolio |
Because of the depth and breadth of our talent, fully integrated self-driving stack, differentiated approach, and unique partnerships that drive commercialization at scale, we believe that we are able to compete favorably across these factors.
go-to-market
Our Growth Strategy
We plan to continue to build on our position as a global leader in self-driving technology through further development of the most advanced and scalable suite of self-driving hardware, software, and data services in the world. Our growth strategy includes the following key elements:
Launch and Expand Commercial Trucking across the U.S.
Since our inception, we have focused on developing the hardware, software, data services, and third party relationships necessary to commercialize the Aurora Driver. Our team is preparing the groundwork necessary for our first driverless commercial trucking product, which we plan to launch in the southwest United States in late 2023. This will provide the basis from which we will expand to cover additional key trucking lanes, which we prioritize based on commercial, technical, and regulatory considerations. We expect to expand nationwide over the course of the decade.
Expand into Passenger Mobility and Local Goods Delivery
In parallel to our trucking efforts, we are developing the Aurora Driver for use in passenger mobility and local goods delivery. We expect to commercialize a ride-hailing product starting in late 2024, leveraging our strategic relationships with Toyota and Uber. Our initial rides commercial product will utilize capabilities also in use in trucking, as many ride hailing and goods delivery routes include highway segments. Our growth in both of these market opportunities will consist of commercial expansion within and across cities.
Expand global footprint.
We intend for the Aurora Driver to serve people and communities around the world. Our commercial operations will start in the United States, but we expect to broaden our footprint to include international markets where the value proposition of our technology is compelling, regulations are conducive, and roadways are comparable. This includes, but is not limited to, Canada, Europe, Japan, and Australia and New Zealand.
Additional Market Sizing Information
We believe that our core target markets of trucking, passenger mobility, and local goods delivery represent enormous potential. We estimate the total of these three markets to be approximately $9.4 trillion globally.
For Trucking, we estimate the global market to represent $4 trillion annually based on research by Armstrong & Associates. We estimate the US trucking market to be over $700 billion, based on research by the American Trucking Association.
For passenger mobility, we estimate the global market to represent $5 trillion annually. We estimate this market size by first estimating total vehicle miles travelled (“VMT”) across different global regions and then
-85-
multiplying it by estimated costs per mile driven for each global region. We calculate VMT per global region by first multiplying passenger distance travelled per capita by percentage of travel by vehicles, and then by population. Through our internal analysis, we are then able to estimate the total VMT per global region as adjusted for year and GDP growth. We source data for these estimates from national statistical agencies and international institutions, such as the World Bank, the US Energy Information Administration and RAND. For the estimated costs per mile we rely on multiple industry and government sources and we average the cost per mile from each of these sources. Using a similar, but more simplified methodology due to readily available VMT data, we estimate the US passenger mobility market to be in excess of $1tn based on Federal Highway Administration, AAA Driving Costs, and the Bureau of Transportation Statistics Household Survey.
For local goods delivery, we estimate the global market to represent approximately $400 billion annually. We calculate the global market in this segment by calculating the estimated US market for local goods delivery and applying the applicable multiplier to obtain a global figure. We calculate the US market by estimating the market sizes of the following US local goods We obtain data for these segments from industry sources such as Pitney Bowes, McKinsey, Cowen, and public company securities filings. We derive the global local delivery market figure by estimating the US share of the global market based on a combination of post and parcel industry research and share of gross domestic product.
delivery sub-segments: last
mile post and parcel delivery, prepared food delivery, grocery delivery, and business-to-business delivery.
To calculate the total of our core target markets, we sum the sizes of our estimated addressable global trucking market, global passenger mobility market, and global local delivery market. While the input data for our estimates is not uniformly from the same year, we believe owing to consistent growth trends across each market segment and the continued global recovery following
the COVID-19 pandemic,
the estimated global transportation market opportunity represents a conservative estimate. Intellectual Property
Our success and competitive advantage depend in part upon our ability to develop and protect our core technology and intellectual property. We own a portfolio of intellectual property, including patents and registered trademarks, confidential technical information, and expertise in the development of software and hardware for autonomous vehicles and lidar technology.
We have filed patent and trademark applications in order to further secure these rights and strengthen our ability to defend against third parties who may infringe on our rights. We also rely on trade secrets, design
and manufacturing know-how, continuing technological
innovations, and licensing and exclusivity opportunities to maintain and improve our competitive position. Additionally, we protect our proprietary rights through agreements with our commercial partners, supply-chain vendors, employees, and consultants, as well as close monitoring of the developments and products in the industry. As of September 30, 2021, we owned over 1,100 patents and pending applications, including U.S. and foreign. In addition, we have 4 registered U.S. trademarks, 25 registered foreign trademarks and 24 pending trademark applications. Our patents and patent applications cover a broad range of technology relevant to self-driving vehicles.
In connection with our acquisition of Apparate, we acquired certain intellectual property that may be the subject of a bankruptcy proceeding claim by Anthony Levandowski. We are not a party to those proceedings. In the event that the bankruptcy court rules in favor of Mr. Levandowski with respect to his bankruptcy claims against Uber, certain of the intellectual property we acquired in our acquisition of Apparate may be adversely affected.
-86-
Material Agreements
PACCAR Strategic Partnership
In January 2021, we entered into a global strategic partnership with PACCAR in preparation for the launch of the Aurora Driver’s first application in trucking. This partnership combines PACCAR’s considerable expertise in heavy-duty truck development, manufacturing, and sales with our deep understanding of autonomous vehicle technology to bring a safe, efficient self-driving product to market quickly and deploy it broadly. This partnership brings PACCAR and Aurora engineering teams together around an accelerated development program to create truly driverless-capable trucks, starting with the Peterbilt 579 and Kenworth T680. PACCAR and Aurora plan to develop a suite of self-driving fleet services, including servicing and maintenance for the deployment and operation of these trucks at scale over the next several years.
Uber Strategic Partnership
In January 2021, we acquired Uber’s self-driving unit. This acquisition expanded our talent base by over 900 employees, and we gained significant research and technical assets that strengthened and accelerated the first Aurora Driver application for heavy-duty trucks while allowing us to continue and accelerate our work on light-vehicle products.
In addition to acquiring Uber’s self-driving unit, we announced a strategic partnership with Uber that connects our technology to the world’s leading ride-hailing platform and strengthens our position to deliver the Aurora Driver broadly. In support of Aurora’s partnership with Uber, Uber invested $400 million in Aurora and Uber Chief Executive Officer Dara Khosrowshahi is a member of our board of directors.
As part of our partnership with Uber, we receive unique access to Uber data. This allows more efficient development and operation, as we are able to refine our market selection and prioritize our capability roadmap based on real-world data.
Toyota Strategic Collaboration
In February 2021, we announced a long-term, global, and strategic collaboration with Toyota and DENSO, one of the largest global automotive manufacturers
and tier-one automotive
suppliers, respectively, to build and globally deploy self-driving cars at scale. As part of this collaboration, our engineering teams will jointly develop and test driverless-capable vehicles equipped with the Aurora Driver, starting with the Toyota Sienna. As part of this long-term effort, we will be exploring mass production of key autonomous driving components with DENSO and a comprehensive services solution with Toyota for when these vehicles are deployed at scale, including financing, insurance, maintenance, and more. These efforts will lay the foundation for the mass-production, launch, and support of these vehicles with Toyota on ride-hailing networks, including Uber’s.
Volvo Group Strategic Partnership
In March 2021, Volvo selected Aurora as its technology provider to develop and commercialize Level 4 Class 8 trucks in North America. Our first commercial truck with Volvo will be adapted to the requirements of the Aurora Driver. These trucks will combine the best of Volvo’s technology with the Aurora Driver into a compelling and scalable logistics platform.
As Volvo’s official technology partner, we will develop an unprecedented autonomous offering with one of the most trusted commercial truck manufacturers in the world. This partnership will be the center of the integration of the Aurora Driver into Volvo’s
on-highway
trucks and development of industry-leading Transportation as a Service solutions. -87-
Government Regulation
At both the federal and state level, the U.S. provides a positive regulatory environment to permit safe testing and development of autonomous vehicle functionality. Aurora’s Government Relations team regularly engages with our partners in government to further develop the relationships and regulations necessary to successfully deploy our technology.
Aurora has developed bipartisan support of self-driving technology in both chambers of the U.S. Congress as well as the U.S. Department of Transportation and its agencies. At Aurora, we work with the federal government to ensure it maintains its regulatory authority over the design, construction, and performance of vehicles and applies that same authority to the regulation of highly automated vehicles.
As vehicles equipped with our sensors are deployed on public roads, we will be subject to legal and regulatory authorities such as the National Highway Traffic Safety Administration (NHTSA), the Federal Motor Carrier Safety Administration (FMCSA), state agencies like Departments of Transportation or Departments of Motor Vehicles, and local transportation departments. The obligations of motor vehicle equipment manufacturers include regular reporting under the Transportation Recall Enhancement, Accountability and Documentation Act, as well as strict recall and reporting requirements for any defects related to highway safety or any
non-compliance
with a Federal Motor Vehicle Safety Standard. As the development of federal, state and foreign legal frameworks around autonomous vehicles continue to evolve, we may be subject to additional regulatory schemes. We do not anticipate any near-term federal standards that would impede the foreseeable deployments of our technology. U.S. federal regulations are largely permissive of deployments of higher levels of safe and responsible autonomous functionality. States, such as Arizona, Florida, Nevada, and Texas, continue to attract self-driving companies with a welcoming regulatory climate that provides the predictability necessary to deploy our technology in those communities. Some states, particularly California, still enforce some operational or registration requirements for certain autonomous functions. We believe such hurdles will be removed as we work with our government partners to highlight the benefits of self-driving technology. We work closely with state and local elected officials and regulatory bodies to ensure they continue to welcome the testing and deployment of self-driving vehicles on their roads. By working with these officials to develop technology neutral policies that promote a diverse set of highly automated vehicle use cases and create a level playing field for the industry, we believe that Aurora will be able deliver the benefits of self-driving technology safely, quickly, and broadly.
Similar such reporting and regulatory requirements exist in foreign markets. For example, markets such as the EU also continue to develop their respective standards to define deployment requirements for higher levels of autonomy. Germany, a leader in the automotive industry, recently approved legislation that would allow for the deployment of self-driving technology without a human driver. Given the intense work in these areas, we expect a workable path forward in the near-term.
We are subject to the Electronic Product Radiation Control Provisions of the Federal Food, Drug, and Cosmetic Act. These requirements are enforced by the U.S. Food and Drug Administration (“FDA”). Electronic product radiation includes laser technology. Regulations governing these products are intended to protect the public from hazardous or unnecessary exposure. Manufacturers are required to certify in product labeling and in reports to the FDA that their products comply with applicable performance standards as well as maintain manufacturing, testing, and distribution records for their products.
Similarly, as a company deploying cutting-edge technology with international partners, we are also subject to trade, customs product classification and sourcing regulations. Finally, our operations are subject to various federal, state and local laws and regulations governing the occupational health and safety of our employees and wage regulations. We are subject to the requirements of the federal Occupational Safety and Health Act, as amended, and comparable state laws that protect and regulate employee health and safety.
-88-
Like all companies operating in similar industries, we are subject to environmental regulation, including water use; air emissions; use of recycled materials; energy sources; the storage, handling, treatment, transportation and disposal of hazardous materials; and the remediation of environmental contamination. Compliance with these rules may include permits, licenses and inspections of our facilities and products.
Corporate Social Responsibilities and Sustainability
Achieving our mission—delivering the benefits of self-driving technology safely, quickly, and broadly—is how we aim to make a positive impact in communities. We strive to revolutionize transportation by making roads safer, providing better services for people who currently have difficulty accessing transportation, freeing up time during commutes, and helping goods more efficiently reach those who need them. Successfully achieving our mission also means promoting development across and around the transportation landscape by creating new opportunities and access to the economy.
As part of our commitment to work with communities where Aurora has a presence and educate them on the benefits of self-driving technology, we partner with local organizations that help bridge the digital divide and promote STEM education. Our Aurora Community Engagement (ACE) Program works with our local partners to identify opportunities for Aurora employees to volunteer in our community specifically with programs that strengthen and diversify the STEM workforce.
Diversity and Inclusion
We are committed to diversity and inclusion. We celebrate the diversity of the people, experiences, and backgrounds that make up Aurora, and we encourage each other to speak up and share perspectives, respectfully and thoughtfully. We are building technology that will impact all people, so we strive to foster and embrace diversity throughout our business and our teams to bring us closer to those we serve.
Sustainability
Fostering a sustainable environment is also important to us. Starting in 2019, we offset our estimated annual carbon emissions from our facilities, vehicles and air travel by purchasing carbon credits, and we expect to continue to do this in the future.
Employees
As of June 30, 2021, we have approximately 1,600 employees. None of our employees are represented by a labor union, and we consider our employee relations to be in good standing. To date, we have not experienced any work stoppages.
Facilities
Our corporate headquarters is located in Pittsburgh, Pennsylvania, where we lease over 590,000 square feet of office and industrial space pursuant to leases that expire between 2021 and 2035. Our Pittsburgh facilities contain R&D, operations and SG&A functions. We lease a test track facility in Pittsburgh of approximately 42 acres pursuant to a lease that expires in 2023. We lease approximately 130,000 square feet of office and industrial space in Mountain View, California. We also have other office and industrial facilities in San Francisco, California, Bozeman, Montana, Dallas/Fort Worth, Texas, Seattle, Washington and Wixom, Michigan.
We believe our facilities are adequate and suitable for our current needs and that, should it be needed, suitable additional or alternative space will be available to accommodate our operations.
-89-
Legal Proceedings
We are from time to time subject to various claims, lawsuits and other legal and administrative proceedings arising in the ordinary course of business. However, we do not consider any such claims, lawsuits or proceedings that are currently pending, individually or in the aggregate, to be material to our business or likely or result in a material adverse effect on our future operating results, financial condition or cash flows.
-90-
CERTAIN RELATIONSHIPS AND RELATED PERSON TRANSACTIONS
The following is a description of each transaction since January 1, 2018, and each currently proposed transaction, in which:
| • | Aurora has been or is to be a participant; |
| • | the amount involved exceeded or exceeds $120,000; and |
| • | any of Aurora’s directors, executive officers, or beneficial holders of more than 5% of any class of Legacy Aurora capital stock, or any immediate family member of, or person sharing the household with, any of these individuals or entities, had or will have a direct or indirect material interest. |
Legacy Aurora Relationships and Related Person Transactions Prior to the Merger
Director-Related Grants
In January 2018, Reid Hoffman, a director of Legacy Aurora and a current director of the Company, entered into a restricted stock agreement with Legacy Aurora under the 2017 Plan, pursuant to which Mr. Hoffman was granted 1,363,590 restricted shares of Legacy Aurora common stock at a fair market value of $156,813. These shares were issued to Mr. Hoffman in connection with his services as a director of Legacy Aurora. In February 2018, Mr. Hoffman transferred the full amount of this grant to Greylock 15 Principals Limited Partnership and related entities (collectively, “Greylock”), each of which is an affiliate of Greylock Partners, of which Mr. Hoffman is a partner.
In January 2018, Mike Volpi, a director of Legacy Aurora and a current director of the Company, entered into a restricted stock agreement with Legacy Aurora under the 2017 Plan, pursuant to which Mr. Volpi was granted 1,363,590 restricted shares of Legacy Aurora common stock at a fair market value of $156,813. These shares were issued to Mr. Volpi in connection with his services as a director of Legacy Aurora. In January 2018, Mr. Volpi transferred the full amount of this grant to Index Ventures Growth III (Jersey) L.P. and a related entity (collectively, “Index”), each of which is an affiliate of Index Ventures, of which Mr. Volpi is a partner.
Equity Financings
Series A Financing
In February 2018, Legacy Aurora issued and sold an aggregate of 29,948,750 shares of its Series A preferred stock, at a purchase price of $2.775672 per share and for an aggregate purchase price of approximately $83,127,906.87 (5,404,090 of which shares were issued pursuant to the conversion of a Simple Agreement for Future Equity that had previously been issued in the amount of $15,000,000). The table below sets forth the number of shares of Legacy Aurora Series A preferred stock sold to Legacy Aurora’s directors, executive officers and holders of more than 5% of Legacy Aurora’s capital stock:
| Investor |
Affiliated Director(s) or Officer(s) |
Shares of Series A Stock |
Total Purchase Price |
|||||||||
| Greylock 15 Principals Limited Partnership and affiliates |
Reid Hoffman | 12,272,330 | $ | 34,063,962.77 | ||||||||
| Index Ventures Growth III (Jersey) L.P. and affiliate (1)
|
Mike Volpi | 12,272,330 | $ | 34,063,962.77 | ||||||||
| |
|
|
|
|||||||||
| Total |
24,544,660 |
$ |
68,127,925.54 |
|||||||||
| |
|
|
|
|||||||||
| (1) | Index collectively transferred 9,006 shares of Legacy Aurora’s Series A preferred stock to a third party in March 2018. |
-91-
Series B Financing
In March 2019 and in
follow-on
closings thereafter, Legacy Aurora issued and sold an aggregate of 69,163,760 shares of its Series B preferred stock, at a purchase price of $9.2403 per share and for an aggregate purchase price of approximately $659,660,766.47. The table below sets forth the number of shares of Legacy Aurora Series B preferred stock sold to Legacy Aurora’s directors, executive officers, holders of more than 5% of Legacy Aurora’s capital stock and an affiliate of RTPY: | Investor |
Affiliated Director(s) or Officer(s) |
Shares of Series B Stock |
Total Purchase Price |
|||||||
| Greylock 15 Principals Limited Partnership and affiliates |
Reid Hoffman | 108,210 | $ | 9,998,928.63 | ||||||
| Sequoia Capital Global Growth Fund III—Endurance Partners, L.P. and affiliate |
Carl Eschenbach | 16,233,230 | $ | 149,999,915.17 | ||||||
| Reinvent Capital Fund LP |
Reid Hoffman | 541,100 | $ | 4,999,926.33 | ||||||
| |
|
|
|
|||||||
| Total |
16,882,540 |
$ |
164,998,770.13 |
|||||||
| |
|
|
|
|||||||
Equity Financing and Apparate Acquisition
Stock Purchase and Agreement and Plan of Merger
In January 2021, Legacy Aurora issued an aggregate of 116,173,646 of its common stock, 50,873,075 shares of its Series
U-1
preferred stock and 20,349,230 shares of its Series U-2
preferred stock, each at a per share purchase price of $19.656763 and for an aggregate consideration of $3,683,597,795.97, pursuant to a stock purchase and agreement and plan of merger originally entered into in December 2020 (as amended, the “Apparate Merger Agreement”). The following table summarizes the holdings of Neben Holdings, LLC (“Neben”), an affiliate of Uber and a 5% holder of Legacy Aurora’s capital stock, as consideration for Legacy Aurora’s acquisition of Apparate following the closing of the transactions contemplated in the Apparate Merger Agreement: | Investor |
Affiliated Director(s) or Officer(s) |
Shares of Common Stock |
Shares of Series U-2 Stock |
Approx. Value of Acquired Stock |
||||||||||||
| Neben Holdings, LLC, an affiliate of Uber |
Dara Khosrowshahi | 112,519,262 | 20,349,230 | $ | 2,611,764,457.42 | |||||||||||
| |
|
|
|
|||||||||||||
| Total |
112,519,262 |
20,349,230 |
||||||||||||||
| |
|
|
|
|||||||||||||
Collaboration Agreement with Uber
In January 2021, Legacy Aurora entered into a Collaboration Agreement with Uber in connection with Legacy Aurora’s acquisition of Apparate. Pursuant to the Collaboration Agreement, Legacy Aurora and Uber agreed to dedicate appropriate resources over the
ten-year
collaboration term towards a goal of deploying Aurora’s self-driving passenger vehicles on Uber’s ridesharing network. Transition Services Agreement with Uber
In January 2021, Legacy Aurora entered into a Transition Services Agreement with Uber in connection with Legacy Aurora’s acquisition of Apparate. Pursuant to the Transition Services Agreement, Uber agreed to provide certain identified transition services to Legacy Aurora during a twelve-month post-closing period.
Irrevocable Proxy with Uber
On June 28, 2021, Legacy Aurora entered into an Amended and Restated Irrevocable Proxy with Uber and Neben in connection with the acquisition of Apparate, pursuant to which Neben agreed to appoint Legacy
-92-
Aurora’s then-current Chief Executive Officer (or, if there is no Chief Executive Officer, an officer designated by Legacy Aurora’s board of directors) as its irrevocable proxyholder over any matter, other than certain excluded matters, requiring or submitted to a vote or consent of the stockholders of Legacy Aurora, whether submitted at a meeting, by written consent, or otherwise. The proxyholder is required to vote shares subject to the Irrevocable Proxy in a manner that is consistent with, and in the same proportions as, other votes cast by all other stockholders entitled to vote on such matters. Under the terms of the Irrevocable Proxy, the proxyholder is permitted to direct the voting of Legacy Aurora shares held by Neben and certain of its affiliates to the extent they exceed the voting power of Neben and such affiliates, disregarding for this purpose the effect of multiple classes of equity with different voting rights. This percentage is subject to adjustment in certain circumstances if investors in Legacy Aurora meeting certain criteria are able to vote a greater percentage of the voting power of outstanding Legacy Aurora stock than Neben and its affiliates. The Irrevocable Proxy survived the Closing of the Merger.
Side Letter with Uber
On June 28, 2021, Legacy Aurora entered into an amended and restated side letter (the “Side Letter”) with Uber in connection with the acquisition of Apparate. Certain terms of the Side Letter terminated upon the Closing. The terms of the Side Letter that survived the Closing of the Merger primarily impose certain restrictions on the ability of Uber to make strategic investments in certain other companies.
Financing Agreements
Investors’ Rights Agreement
In January 2021, Legacy Aurora entered into the Amended and Restated Investors’ Rights Agreement, (the “Investors’ Rights Agreement”) in connection with the acquisition of Apparate, pursuant to which it granted registration rights and information rights, among other things, to certain holders of Legacy Aurora’s capital stock including: (i) Chris Urmson, an executive officer and director of Legacy Aurora and a 5% holder of Legacy Aurora capital stock; (ii) Neben, a 5% holder of Legacy Aurora capital stock; (iii) Sterling Anderson, a director of Legacy Aurora; and (iv) William Mouat, executive officer of Legacy Aurora. The Investors’ Rights Agreement terminated upon the Closing of the Merger.
Right of First Refusal
In January 2021, Legacy Aurora entered into the Amended and Restated Right of First Refusal and
Co-Sale
Agreement (the “ROFR Agreement”) in connection with the acquisition of Apparate, pursuant to which Legacy Aurora had a primary right to purchase shares of Legacy Aurora capital stock which certain stockholders propose to sell to third parties and certain Legacy Aurora investors party to the ROFR Agreement had a secondary right of refusal and co-sale
rights in connection therewith. Certain holders of Legacy Aurora capital stock, including Mr. Bagnell, a director of Legacy Aurora and a current director of the Company, Mr. Urmson, Mr. Anderson and Neben were party to the ROFR Agreement, with Messrs. Bagnell, Urmson and Anderson subject to restrictions on the ability to sell certain of their respective shares pursuant to the terms thereunder. The ROFR Agreement terminated upon the Closing of the Merger. Voting Agreement
In January 2021, Legacy Aurora entered into the Amended and Restated Voting Agreement (the “Voting Agreement”) in connection with the acquisition of Apparate, pursuant to which certain holders of its capital stock, including Chris Urmson, Sterling Anderson, James Andrew Bagnell and Neben, agreed to vote their shares of Legacy Aurora’s capital stock on certain matters, including with respect to the election of directors. The Voting Agreement terminated upon the Closing of the Merger.
-93-
Agreements with Employees, Directors and Officers
Employment Compensation
Sterling Anderson served as a director and employee of Legacy Aurora and serves as a director and employee of the Company. In his capacity as an employee of Legacy Aurora, Mr. Anderson received a base salary of $330,000 during the 2020 fiscal year and a bonus cash payment of $41,250. Mr. Anderson’s salary increased to $360,000 in February 2021.
James Andrew Bagnell served as a director and employee of Legacy Aurora and serves as a director and employee of the Company. In his capacity as an employee of Legacy Aurora, Mr. Bagnell received a base salary of $330,000 during the 2020 fiscal year and a bonus cash payment of $41,250. Mr. Bagnell’s salary increased to $340,000 in February 2021.
Director and Officer Indemnification
Legacy Aurora’s charter and bylaws provided for indemnification and advancement of expenses for its directors and officers to the fullest extent permitted by the DGCL, subject to certain limited exceptions. Legacy Aurora entered into indemnification agreements with each of its directors and William Mouat, Legacy Aurora’s general counsel and an executive officer of Legacy Aurora. Following the Business Combination, these agreements were replaced with new indemnification agreements for each post-Closing director and executive officer of Aurora. For additional information, see “.”
Description of Capital Stock—Limitations of Liability and Indemnification
RTPY Relationships and Related Person Transactions Prior to the Merger
Founder Shares
On October 7, 2020 the Sponsor purchased 2,875,000 Class B ordinary shares of RTPY (the “Founder Shares”) for an aggregate purchase price of $25,000, or approximately $0.0087 per share. On February 10, 2021, RTPY effected a share capitalization resulting in the Sponsor holding an aggregate of 24,437,500 Founder Shares. Subsequent to the share capitalization, the Sponsor transferred 30,000 Founder Shares to each of RTPY’s independent directors. The number of Founder Shares issued was determined based on the expectation that the Founder Shares would represent 20% of the outstanding shares of RTPY ordinary shares upon completion of the RTPY IPO. In connection with the Business Combination, upon the Domestication, 24,437,500 RTPY Founder Shares converted automatically, on into one share of Class A Common Stock.
a one-for-one basis,
Private Placement Warrants
Simultaneously with the consummation of the RTPY IPO, the Sponsor purchased 8,900,000 Private Placement Warrants at a price of $2.50 per warrant, or $22,250,000 in the aggregate, in a private placement. Each Private Placement Warrant entitles the holder to purchase one RTPY Class A ordinary share for $11.50 per share. A portion of the proceeds from the sale of the private placement warrants was placed in the trust account of RTPY.
The Private Placement Warrants are identical to the warrants included in the units sold in the RTPY IPO except that, so long as they are held by the Sponsor or its permitted transferees, the Private Placement Warrants: (i) are not redeemable by RTPY (except in certain redemption scenarios when the price per Class A ordinary share equals or exceeds $10.00 (as adjusted)), (ii) may be exercised on a cashless basis and (iii) are entitled to registration rights (including the ordinary shares issuable upon exercise of the Private Placement Warrants). Additionally, the purchasers have agreed not to transfer, assign or sell any of the Private Placement Warrants, including the RTPY Class A ordinary shares issuable upon exercise of the Private Placement Warrants (except to certain permitted transferees), until 30 days after the Closing.
-94-
In connection with the Business Combination, upon the Domestication, each of the 8,900,000 Private Placement Warrants converted automatically into a warrant to acquire one share of Legacy Aurora common stock pursuant to the Warrant Agreement.
Registration Rights
On March 15, 2021, the holders of the RTPY Founder Shares, Private Placement Warrants, and warrants that may be issued upon conversion of working capital loans, if any (and any RTPY Class A ordinary shares that were issuable upon the exercise of the Private Placement Warrants or warrants issued upon conversion of the working capital loans and upon conversion of the RTPY Founder Shares) entered into a registration rights agreement requiring RTPY to register such securities for resale (in the case of the RTPY Founder Shares, only after conversion to RTPY Class A ordinary shares). The holders of these securities were entitled to make up to three demands, excluding short form demands, that RTPY register such securities. In addition, the holders had certain “piggy-back” registration rights with respect to registration statements filed subsequent to the completion of RTPY’s initial business combination and rights to require RTPY to register for resale such securities pursuant to Rule 415 under the Securities Act. In connection with the Business Combination, the registration rights agreement was amended and restated. For additional information, see “—.”
Certain Relationships and Related Person Transactions—Registration Rights Agreement
Subscription Agreements
On July 14, 2021, concurrently with the execution of the Merger Agreement, RTPY entered into subscription agreements with the Sponsor Related PIPE Investor, pursuant to which the Sponsor Related PIPE Investor subscribed for shares of Class A Common Stock in connection with the PIPE Investment. The Sponsor Related PIPE Investor, Reinvent Technology SPV II LLC, is a special purpose vehicle formed solely to invest in the PIPE Investment and received 7,500,000 shares of Class A Common Stock for a purchase price of $75,000,000. In addition, certain directors and officers of RTPY, including Mr. Thompson, have economic interests in the Sponsor Related PIPE Investor and our board observer, Mr. Hoffman, has an economic interest in the Sponsor Related PIPE Investor. The PIPE Investment was consummated substantially concurrently with the Closing of the Merger.
Sponsor Agreement
On July 14, 2021, RTPY entered into the Sponsor Agreement with the Sponsor and Legacy Aurora, pursuant to which the parties thereto agreed, among other things, that (i) in the event that more than 22.5% of the outstanding RTPY Class A ordinary shares were redeemed, and the Sponsor, any affiliate of the Sponsor or any other person arranged by the Sponsor had not provided backstop or alternative financing to replace such redemptions above the 22.5% threshold, the Sponsor would forfeit a number of RTPY Class B ordinary shares then owned by the Sponsor immediately before the Domestication, (ii) subject to the forfeiture (if any) described in the immediately preceding clause, shares held by the Sponsor as of the Domestication would be subject to certain vesting and
lock-up
terms, (iii) the Sponsor agreed to exercise all of its Private Placement Warrants for cash or on a “cashless basis” on or prior to the date upon which Aurora elects to redeem the public warrants in accordance with the Warrant Agreement, if the last reported sales price of the Class A Common Stock for any 20 trading days within the 30 trading-day period
ending on the third trading day prior to the date on which notice of the redemption is given exceeds $18.00 per share (subject to certain adjustments) and (iv) the Sponsor will have certain rights with respect to board representation of Aurora. A total of 17,434,414 Class B ordinary shares were forfeited by the Sponsor in accordance with the terms of the Sponsor Agreement. Sponsor Support Agreement
On July 14, 2021, in connection with the execution of the Merger Agreement, RTPY, each of the directors (other than Karen Francis, who has recused herself from discussions of the RTPY Board about the proposed
-95-
Business Combination and voting as a director on matters related to the proposed Business Combination) and officers of RTPY, the Sponsor and Legacy Aurora entered into the Sponsor Support Agreement, a copy of which is attached to this prospectus as Annex B. Pursuant to the Sponsor Support Agreement, the Sponsor and each of the directors (other than Ms. Francis, who has recused herself from discussions of the RTPY Board about the proposed Business Combination and voting as a director on matters related to the proposed Business Combination) and officers of RTPY agreed to, among other things, vote to adopt and approve the Merger Agreement and all other documents and transactions contemplated thereby, in each case, subject to the terms and conditions of the Sponsor Support Agreement. The Sponsor Support Agreement terminated upon the Closing of the Merger.
Support Services Agreement
On March 15, 2021, RTPY entered into the Support Services Agreement that provides that, commencing on the date that RTPY’s securities are first listed on Nasdaq through the earlier of consummation of the initial business combination and liquidation, RTPY will pay support services fees to Reinvent Capital LLC (“Reinvent Capital”) that total $1,875,000 per year for support and administrative services, as well as reimburse Reinvent Capital for it incurs in connection with providing services or for office space under the Support Services Agreement. As of immediately prior to the Closing of the Merger, there was $1,406,250 outstanding amount in services fee and reimbursable expenses for which Reinvent Capital was awaiting payment or reimbursement by RTPY, which would be made from funds held outside the trust account, including funds released from the trust account to pay for working capital, subject to an annual limit of $701,250. The services fee and reimbursable expenses were fully paid to and reimbursed to Reinvent Capital at the Closing of the Merger and the Support Services Agreement terminated upon the Closing of the Merger.
any out-of-pocket expenses
Aurora Related Person Transactions
Subscription Agreements
In connection with the execution of the Merger Agreement, RTPY and the PIPE Investors entered into the Subscription Agreements, pursuant to which the PIPE Investors subscribed for, collectively, 100,000,000 shares of Class A Common Stock, at $10.00 per share for an aggregate purchase price of $1,000,000,000. The PIPE Investment was consummated substantially concurrently with the Closing of the Merger.
Registration Rights Agreement
At the Closing of the Merger, the Company, RTPY and the Sponsor entered into the Registration Rights Agreement with certain affiliates of the Sponsor and certain stockholders of Aurora named therein, which provides for customary “demand” and “piggyback” registration rights for certain stockholders. See “,” for more information.
Description of Capital Stock—Registration Rights
Policies and Procedures for Related Person Transactions
We have adopted a written related person transaction policy that sets forth the following policies and procedures for the review and approval or ratification of related person transactions. A “related person transaction” is a transaction, arrangement or relationship (or any series of similar transactions, arrangements or relationships) or any proposed transaction, arrangement or relationship, in which the Company is a participant and in which any Related Person has, had, or will have a direct or indirect material interest. A “related person” means:
| • | any person who is, or at any time since the beginning of the Company’s last fiscal year was, a director or executive officer of the Company; |
| • | any person or entity known by the Company to be the beneficial owner of more than 5% of any class of the Company’s voting securities (a “5% Stockholder”); and |
-96-
| • | any immediate family member of any of the foregoing persons, which means a child, stepchild, parent, stepparent, spouse, sibling, mother-in-law, father-in-law, son-in-law, daughter-in-law, brother-in-law sister-in-law |
Aurora has policies and procedures designed to minimize potential conflicts of interest arising from any dealings it may have with its affiliates and to provide appropriate procedures for the disclosure of any real or potential conflicts of interest that may exist from time to time. Specifically, pursuant to its audit committee charter, the audit committee has the responsibility to review related party transactions.
Lock-Up
Agreements At the Closing, Aurora and the Major Company Equityholders (as defined in the Merger Agreement) entered into the Lockup Agreement. The Major Company Equityholders include, among others, Chris Urmson, Sterling Anderson and Drew Bagnell.
The Stockholder
Lock-Up
Agreement contains certain restrictions on transfer with respect to shares of common stock held by the Major Company Equityholders immediately following the Closing (other than shares purchased in the public market or in the PIPE Investment) and the shares of common stock issuable to such persons upon settlement or exercise of restricted stock units, stock options or other equity awards outstanding as of immediately following the Closing in respect of Aurora outstanding immediately prior to the Closing (the “Lock-up
Shares”). Such restrictions began at the Closing and end in tranches of 25% of the Major Company Equityholders’ Lock-up
Shares at each of (i) the one year anniversary of Closing, (ii) the two-year
anniversary of the Closing, (iii) the three-year anniversary of the Closing and (iv) the four-year anniversary of the Closing. If the Company completes a transaction that results in a change of control, the Lock-up
Shares are released from restriction immediately prior to such change of control. -97-
MANAGEMENT
Executive Officers and Directors
The following table sets forth the names, ages, and positions of our executive officers and directors as of the date of this prospectus:
| Name |
Age |
Position | ||||
| Executive Officers |
||||||
| Chris Urmson |
45 | Chief Executive Officer, President and Director | ||||
| Richard Tame |
44 | Vice President of Finance | ||||
| William Mouat |
45 | General Counsel, Vice President, Secretary and Treasurer | ||||
| Employee Directors |
||||||
| Sterling Anderson |
38 | Director | ||||
| James Andrew Bagnell |
45 | Director | ||||
| Non-Employee Directors |
||||||
| Reid Hoffman (2)(3)
|
54 | Director | ||||
| Dara Khosrowshahi (3)
|
52 | Director | ||||
| Michelangelo Volpi (1)(2)
|
54 | Director | ||||
| Carl Eschenbach (1)(3)
|
54 | Director | ||||
| Brittany Bagley (1)(2)
|
38 | Director | ||||
| (1) | Member of the Audit Committee. |
| (2) | Member of the Compensation Committee. |
| (3) | Member of the Nominating and Governance Committee. |
Executive Officers
Chris Urmson
a co-founder of
Aurora and has served as Chief Executive Officer and a director on the Board at Aurora since its formation in 2017. Prior to founding Aurora, Mr. Urmson helped build Google’s self-driving program from 2009 to 2016 and served as Chief Technology Officer of the group. Mr. Urmson has over 15 years of experience leading automated vehicle programs. He was the Director of Technology for Carnegie Mellon’s DARPA Grand and Urban Challenge Teams, which placed second and third in 2005, and first in 2007. Mr. Urmson earned his Ph.D. in Robotics from Carnegie Mellon University and his BEng in Computer Engineering from the University of Manitoba. Mr. Urmson currently serves on Carnegie Mellon’s School of Computer Science Dean’s Advisory Board. Mr. Urmson also currently serves on the board of directors for Edge Case Research, a company working to assure the safety of autonomous systems for real world deployment. Additionally, he is on the Veoneer Technical Advisory Board, and the Shell New Energies External Advisory Board. Mr. Urmson has authored over 50 publications and is a prolific inventor. We believe Mr. Urmson is qualified to serve on our board of directors, given his extensive technical and leadership experience in the self-driving sector, and the unique perspective he brings as one of Aurora’s co-founders and
current Chief Executive Officer. Richard Tame
-98-
Airlines, Inc. from October 2005 to April 2007, British Airways plc from November 2001 to May 2005, and Deloitte & Touche LLP from September 1998 to November 2001. From October 2011 to September 2012, Mr. Tame provided consulting services to aircraft leasing companies, airlines and their investors as an independent consultant. Hailing from England, Mr. Tame holds a BSc (Hons) degree in Statistics from Newcastle University, Newcastle Upon Tyne, UK and is a UK Chartered Accountant (ACA) and Chartered Tax Advisor (CTA). Mr. Tame’s extensive knowledge of finance strategy and operations in the technology and transportation industries, including self-driving technology, has uniquely positioned him for his current role at the Company.
William Mouat
Board of Directors
Employee Directors
Sterling Anderson.
a co-founder of
Aurora and has served as its Chief Product Officer and a director on its Board since its formation in 2017. Mr. Anderson has spent over 12 years leading advanced vehicle programs. Prior to founding Aurora, Mr. Anderson led the design, development, and launch of the award-winning Tesla Model X, and led the team that delivered Tesla Autopilot. In the late 2000s, he developed MIT’s Intelligent Co-Pilot, a
shared autonomy framework that paved the way for broad advances in cooperative control of human-machine systems. Mr. Anderson holds multiple patents and over a dozen publications in autonomous vehicle systems, and an MS and PhD from MIT. We believe Mr. Anderson is qualified to serve on our board of directors because of his deep experience in the self-driving industry, strong technical knowledge and the unique perspective he brings as a co-founder of
Aurora. James Andrew Bagnell.
a co-founder of
Aurora and currently serves as its Chief Scientist and a director of its Board. He has served as a member of Aurora’s directors since the formation of its board. Mr. Bagnell served as Chief Technical Officer of Aurora from December 2016 until July 2020 and has led software engineering throughout much of Aurora’s history. He also currently serves as a Consulting Professor at Carnegie Mellon University’s Robotics Institute and Machine Learning (ML) Department. He has worked over two decades at the intersection of ML and robotics in industrial and academic roles. His research group has received over a dozen research awards for publications in both the robotics and ML communities including best paper awards at the International Conference on Machine Learning, Robotics Science and System, and Neural Information Processing Systems. Mr. Bagnell received the 2016 Ryan Award, Carnegie Mellon’s yearly award for Meritorious Teaching, and was founding director of the Robotics Institute Summer Scholars program, a research experience that has enabled hundreds of undergraduates throughout the world to leap into robotics research. Before co-founding Aurora,
Mr. Bagnell served as the Head of Perception and Autonomy Architect at Uber’s Advanced Technology Group from January 2015 to December 2016 and as a professor at Carnegie Mellon from 2004-2018. He holds a Ph.D. in Robotics from Carnegie Mellon and a B.S. in Electrical Engineering from the University of Florida. We believe Mr. Bagnell is qualified to serve on our board of directors because of his deep experience in the self-driving industry, strong technical knowledge and the unique perspective he brings as a co-founder of
Aurora. Non-Employee Directors
Reid Hoffman
a co-founding member
of Reinvent Capital. Mr. Hoffman is a co-founding member
of Reinvent Capital. -99-
He co-founded LinkedIn,
served as its founding Chief Executive Officer, and served as its Executive Chairman until the company’s acquisition by Microsoft for $26.2 billion. Early in his career, he was Chief Operating Officer and Executive Vice President and served on the founding board of directors of PayPal. Mr. Hoffman is a Partner at Greylock (joining Greylock in 2009), a leading Silicon Valley venture capital firm, where he focuses on investing in technology products that can reach hundreds of millions of people. Mr. Hoffman currently serves as Co-Lead Director
of Reinvent Technology Partners and Reinvent Technology Partners Z. He is also expected to serve as a board observer of RTPX upon the completion of its initial public offering. He also serves on Microsoft’s Board and as a director or observer for a number of private companies including Apollo Fusion, Aurora, Blockstream, Coda, Convoy, Entrepreneur First, Nauto, Neeva, and Xapo. Additionally, Mr. Hoffman also serves on ten not-for-profit boards,
the co-author of
Blitzscaling: The Lightning-Fast Path to Building Massively Valuable Companies and two New York Times best-selling books: The Start-up of
You and The Alliance. He also hosts the podcast Masters of Scale. Mr. Hoffman earned a master’s degree in philosophy from Oxford University, where he was a Marshall Scholar, and a bachelor’s degree with distinction in symbolic systems from Stanford University. Mr. Hoffman has an honorary doctorate from Babson College and an honorary fellowship from Wolfson College, Oxford University. Mr. Hoffman has received a number of awards, including the Salute to Greatness from the Martin Luther King Center. We believe Mr. Hoffman is qualified to serve on our board of directors because of his extensive leadership and investing experience in the technology industry and knowledge of high-growth companies. Dara Khosrowshahi.
Michelangelo Volpi
.
-100-
a member of our board of directors due to his extensive experience in senior leadership positions at technology and other companies.
Carl M. Eschenbach.
VMware’s Co-President and
Chief Operating Officer from April 2012 to December 2012, as Co-President, Customer Operations from January 2011 to April 2012, and as Executive Vice President of Worldwide Field Operations from May 2005 to January 2011. Mr. Eschenbach currently serves on the board of directors of UiPath, Inc., Zoom Video Communications, Inc., Snowflake, Inc., Workday, Inc., and Palo Alto Networks, Inc., as well as several private companies. Mr. Eschenbach holds an Electronics Technician diploma from DeVry University. We believe Mr. Eschenbach is qualified to serve on our board of directors because of his operational and sales experience in the technology industry and knowledge of high-growth companies. Brittany Bagley.
Family Relationships
There are no family relationships among any of the executive officers or directors of the Company.
Code of Business Conduct and Ethics
The Board has adopted a code of business conduct and ethics that applies to all of our directors, officers and employees, including our principal executive officer, principal financial officer, principal accounting officer or controller or persons performing similar functions, as well as our contractors, consultants and agents. The full text of the Aurora’s code of business conduct and ethics are posted on the investor relations page on our website at . We will disclose any amendments to our code of business conduct and ethics, or waivers of its requirements, applicable to our principal executive officer, principal financial officer, principal accounting officer or controller, or persons performing similar functions, on our website identified above, or in filings under the Exchange Act.
www. Aurora.tech
Board of Directors
Aurora’s business and affairs are managed under the direction of the Board. The Board consists of eight (8) directors. The number of directors is fixed by the Board, subject to the terms of our amended and restated certificate of incorporation and amended and restated bylaws. Each of our directors will continue to serve as a director until the election and qualification of his or her successor, or until his or her earlier death, resignation or removal.
Classified Board of Directors
We adopted the amended and restated Certificate of Incorporation on November 3, 2021. Our Certificate of Incorporation provides that the Board is divided into three classes with staggered three-year terms. Only one
-101-
Class of directors is elected at each annual meeting of our stockholders, with the other classes continuing for the remainder of their respective three-year terms. Our directors are divided among the three classes as follows:
| • | the Class I directors are Chris Urmson and Sterling Anderson, and their terms will expire at the annual meeting of stockholders to be held in the year that Class I director term will expire; |
| • | the Class II directors are Michelangelo Volpi, Carl Eschenbach and Dara Khosrowshahi, and their terms will expire at the annual meeting of stockholders to be held in the year that Class II director term will expire; and |
| • | the Class III directors are Reid Hoffman, Brittany Bagley and James Andrew Bagnell, and their terms will expire at the annual meeting of stockholders to be held in the year that Class III director term will expire. |
The Certificate of Incorporation provides that any increase or decrease in the number of directors must be distributed among the three classes so that, as nearly as possible, each Class will consist of —”.
one-third
of the directors. The classification of the Board with staggered three-year terms may have the effect of delaying or preventing changes in control of the Company. See “Description of Capital Stock
Anti-Takeover Provisions
Director Independence
As a result of our common stock being listed on Nasdaq it is required to comply with the applicable rules of Nasdaq in determining whether a director is independent. Prior to the completion of this Business Combination, the parties undertook a review of the independence of the individuals named above and have determined that each of them qualifies as “independent” as defined under the applicable Nasdaq rules.
Audit Committee
Our audit committee consists of Brittany Bagley, Carl Eschenbach and Michelangelo Volpi. Our Board has determined that each of the members of the audit committee meet the requirements for independence under the rules and regulations of the SEC and the listing standards of Nasdaq applicable to audit committee members and also meet the financial literacy requirements of the listing standards of Nasdaq.
Brittany Bagley serves as the chair of the audit committee. Our Board has determined that Ms. Bagley qualifies as an audit committee financial expert within the meaning of Item 407(d) of
Regulation S-K
under the Securities Act. In making this determination, our Board considered Ms. Bagley’s formal education and previous experience in financial roles. Both our independent registered public accounting firm and management will periodically meet privately with our audit committee. Our audit committee is responsible for the following duties, among others:
| • | appointing, compensating, retaining, evaluating, terminating and overseeing our independent registered public accounting firm; |
| • | discussing with our independent registered public accounting firm their independence from management; |
| • | reviewing with our independent registered public accounting firm the scope and results of their audit; |
| • | pre-approving all audit and permissible non-audit services to be performed by our independent registered public accounting firm; |
| • | overseeing the financial reporting process and discussing with management and our independent registered public accounting firm the interim and annual financial statements that we file with the SEC; |
-102-
| • | reviewing and monitoring our accounting principles, accounting policies, financial and accounting controls and compliance with legal and regulatory requirements; and |
| • | establishing procedures for the confidential anonymous submission of concerns regarding questionable accounting, internal controls or auditing matters. |
The composition and function of the audit committee comply with all applicable requirements of the Sarbanes-Oxley Act and all applicable SEC rules and regulations. We will comply with future requirements to the extent they become applicable.
Compensation Committee
Our compensation committee consists of Michelangelo Volpi, Reid Hoffman and Brittany Bagley, with Michelangelo Volpi serving as chairperson. Our Board has determined that each member of the compensation committee meets the requirements for independence under the rules and regulations of the SEC and the listing standards of Nasdaq applicable to compensation committee members, and that each member of the compensation committee is also a
non-employee
director, as defined pursuant to Rule 16b-3
promulgated under the Exchange Act. Our compensation committee is responsible for the following duties, among other things:
| • | reviewing and approving corporate goals and objectives relevant to the compensation of our Chief Executive Officer, evaluating the performance of our Chief Executive Officer in light of these goals and objectives and setting or making recommendations to the Aurora Innovation Board regarding the compensation of our Chief Executive Officer; |
| • | reviewing and setting or making recommendations to the Board regarding the compensation of our other executive officers; |
| • | making recommendations to the Board regarding the compensation of our directors; |
| • | reviewing and approving or making recommendations to the Board regarding our incentive compensation and equity-based plans and arrangements; and |
| • | appointing and overseeing any compensation consultants. |
Our compensation committee operates under a written charter and will comply with all applicable requirements of the Sarbanes-Oxley Act and all applicable SEC rules and regulations. We will comply with future requirements to the extent they become applicable.
Nominating and Corporate Governance Committee
Our nominating and corporate governance committee consists of Reid Hoffman, Carl Eschenbach and Dara Khosrowshahi, with Reid Hoffman serving as chairperson. Our Board has determined that our nominating and corporate governance committee meets the requirements for independence under the listing standards of Nasdaq.
Our nominating and corporate governance committee is responsible for the following duties, among other things:
| • | identifying individuals qualified to become members of the Board, consistent with criteria approved by the Board; |
| • | recommending to the Board the nominees for election to the Board at annual meetings of our stockholders; |
| • | overseeing an evaluation of the Board and its committees; and |
| • | developing and recommending to the Board a set of corporate governance guidelines. |
-103-
The composition and function of the nominating and corporate governance committee complies with all applicable requirements of the Sarbanes-Oxley Act and all applicable SEC and the Nasdaq rules and regulations. We will comply with future requirements to the extent they become applicable.
Compensation Committee Interlocks and Insider Participation
None of the members of our compensation committee has ever been an executive officer or employee of the Company. None of our executive officers currently serves, or has served during the last completed fiscal year, on the compensation committee or board of directors of any other entity that has one or more executive officers that serve on our Board or compensation committee.
-104-
EXECUTIVE COMPENSATION
This section provides an overview of Aurora’s executive compensation programs, including a narrative description of the material factors necessary to understand the information disclosed in the summary compensation table below.
For the fiscal year ended December 31, 2020, Aurora’s named executive officers were:
| • | Chris Urmson—Chief Executive Officer and President |
| • | William Mouat—General Counsel, Vice President, Treasurer and Secretary |
| • | Richard Tame—Vice President of Finance |
This discussion may contain forward-looking statements that are based on our current plans, considerations, expectations and determinations regarding future compensation programs. Actual compensation programs that we adopt could vary significantly from Aurora’s historical practices and currently planned programs summarized in this discussion.
Named Executive Officers Summary Compensation Table
The following table sets forth information concerning the compensation of the named executive officers for the fiscal year ended December 31, 2020.
| Name and Principal Position |
Year |
Salary ($) |
Bonus ($) (3)
|
Option Awards ($) (5)
|
Total ($) |
|||||||||||||||
| Chris Urmson Chief Executive Officer and President |
2020 | 330,000 | 41,250 | — | 371,250 | |||||||||||||||
| William Mouat General Counsel, Vice President, Treasurer and Secretary |
2020 | 346,923 | 43,365 | 133,461 | 523,749 | |||||||||||||||
| Richard Tame Vice President of Finance |
2020 | 195,192 | 74,399 | 1,013,474 | 1,283,065 | |||||||||||||||
| (1) | Represents amounts paid in 2020. Mr. Mouat’s annual base salary was increased from $330,000 to $350,000 effective February 23, 2020. |
| (2) | Represents amounts paid in 2020. Mr. Tame’s annual base salary in 2020 was $350,000, and his employment began on June 8, 2020. |
| (3) | Represents annual bonuses earned during 2020 and paid in 2021, except as noted. |
| (4) | Represents $50,000 for a sign-on bonus paid in 2020 and $24,399 for an annual bonus earned during 2020 and paid in 2021. |
| (5) | Amounts reported represent the aggregate grant date fair value of stock options granted to Aurora’s named executive officers during 2020 computed in accordance with FASB ASC Topic 718. Assumptions used in the calculation of this amount are included in Note 7 to the audited consolidated financial statements included in this prospectus. |
Narrative Disclosure to Named Executive Officers Summary Compensation Table
For 2020, the compensation program for Aurora’s named executive officers consisted of base salary, bonuses and incentive compensation delivered in the form of stock option awards.
Base Salary
Base salaries are set at a level that is commensurate with the executive’s duties and authorities, contributions, prior experience and sustained performance. Base salaries are reviewed annually, typically in
-105-
connection with Aurora’s annual performance review process, and adjusted from time to time to realign salaries with market levels after taking into account individual responsibilities, performance and experience. For the year ended December 31, 2020, the annual base salary of Mr. Urmson was $330,000 and of Messrs. Mouat and Tame was $350,000.
Cash Bonus
Aurora’s named executive officers are each eligible for an annual bonus targeted at a specified percentage of their salary for that year. For the year ended December 31, 2020, the annual bonus target for each of Messrs. Urmson, Mouat, and Tame was 12.5%. Such annual bonus program does not have a written plan document and is paid solely at Aurora’s discretion.
Stock Option Awards
Aurora has historically granted stock options under its 2017 Plan to its employees, consultants, and directors, including certain of its named executive officers. In order to provide a long-term incentive, these stock options generally vest over four years subject to continued service. Aurora did not grant any equity awards to Mr. Urmson in 2020. Vesting terms of stock options granted to Aurora’s named executive officers that were outstanding as of December 31, 2020 are set forth in the “Outstanding Equity Awards at Fiscal 2020 Year End” table below.
Employee Incentive Compensation Plan
The Employee Incentive Compensation Plan, or the Incentive Compensation Plan, was adopted in connection with the Merger and became effective upon the Closing of the Merger. Our Incentive Compensation Plan allows our compensation committee to provide cash incentive awards to employees selected by our compensation committee, including our named executive officers, based upon performance goals established by our compensation committee. Pursuant to the Incentive Compensation Plan, our compensation committee, in its sole discretion, establishes a target award for each participant and a bonus pool, with actual awards payable from such bonus pool, with respect to the applicable performance period.
Outstanding Equity Awards at Fiscal 2020 Year End
The following table presents information regarding outstanding equity awards held by Aurora’s named executive officers as of December 31, 2020:
Option Awards |
Stock Awards |
|||||||||||||||||||||||||||
| Name |
Grant Date |
Number of Securities Underlying Unexercised Options Exercisable (#) |
Number of Securities Underlying Unexercised Options Unexercisable (#) |
Option Exercise Price ($) |
Option Expiration Date |
Number of Shares or Units of Stock That Have Not Vested (#) |
Market Value of Shares or Units of Stock That Have Not Vested ($) (1)
|
|||||||||||||||||||||
| Chris Urmson |
— | — | — | — | — | — | — | |||||||||||||||||||||
| William Mouat |
1/7/2017 | 62,500 |
(2) |
480,323 | ||||||||||||||||||||||||
| 2/14/2017 | 20,834 |
(3) |
160,113 | |||||||||||||||||||||||||
| 2/26/2020 | 28,125 | 46,875 |
(4) |
3.045 | 2/26/2030 | |||||||||||||||||||||||
| Richard Tame |
7/15/2020 | 0 | 300,000 |
(5) |
3.15 | 7/15/2030 | ||||||||||||||||||||||
| (1) | This amount reflects the fair market value of Aurora’s common stock of $7.69 per share as of December 31, 2020, multiplied by the amount shown in the column for Number of Shares of Stock That Have Not Vested. |
| (2) | 1/4th of the shares of restricted stock subject to the award vested on February 1, 2018, and 1/48th of the shares subject to the award vest each month thereafter, subject to continued service with Aurora through the applicable vesting date. |
-106-
| (3) | 1/4th of the shares of restricted stock subject to the award vested on February 14, 2018 and 1/48th of the shares subject to the award vest each month thereafter, subject to continued service with Aurora through the applicable vesting date. |
| (4) | 1/24th of the shares subject to the option vest each month following March 1, 2020, subject to continued service with Aurora through the applicable vesting date. |
| (5) | 1/4th of the shares subject to the option vest on June 8, 2021 and 1/48th of the shares subject to the option vest each month thereafter, subject to continued service with Aurora through the applicable vesting date. |
Employment Arrangements with Named Executive Officers
Chris Urmson
Mr. Urmson’s current annual base salary is $330,000, and his annual target bonus is 30% of his annual base salary.
William Mouat
We have entered into an employment letter with Mr. Mouat, our General Counsel, Vice President, Treasurer and Secretary. The employment letter currently has no specific term and provides
for at-will employment.
Mr. Mouat’s current annual base salary is $360,000, and his annual target bonus is 30% of his annual base salary. Richard Tame
We have entered into an employment letter with Mr. Tame, our Vice President of Finance. The employment letter has no specific term and provides
for at-will employment.
Mr. Tame’s current annual base salary is $360,000, and his annual target bonus is 30% of his annual base salary. His employment letter agreement provided for a signing bonus of up to $100,000, which was payable in two installments, the first following his start date and the second following the one-year anniversary
of his start date, subject to a specified repayment requirement in the event that his employment is terminated by the Company with cause (as defined in his employment letter agreement) or voluntarily by him. His employment agreement also provides for the grant of an award of 300,000 options to purchase Aurora’s common stock, with vesting over 4 years subject to his continued service, which grant has been made.
Benefits and Perquisites
Aurora provides benefits to its named executive officers on the same basis as provided to all of its employees, including group life and disability insurance and travel insurance. Aurora does not maintain any executive-specific benefit or perquisite programs.
Potential Payments upon Termination or Change in Control
Prior to the consummation of the Merger, Aurora did not have a formal plan with respect to severance benefits payable to its named executive officers and other key employees. From time to time, Aurora granted equity awards to, or entered into offer letters with, certain key employees that provide for severance benefits or accelerated vesting of equity awards in the event such key employee’s employment was involuntarily terminated. The named executive officers did not enter into such arrangements.
Mr. Mouat was granted 50,000 RSUs under the 2017 Plan in March 2021, the first 1/8th of which time vested on May 20, 2021. Such award continues to time vest in equal quarterly installments for seven quarters
-107-
thereafter, subject to Mr. Mouat’s continued service and is also subject to the occurrence of a liquidity event condition. The Closing satisfied the liquidity event condition, leading the time vested portion of Mr. Mouat’s award to become fully vested.
Employee Benefit and Stock Plans
2017 Equity Incentive Plan
Aurora’s 2017 Plan was originally adopted and approved by stockholders in December 2017 and was most recently amended in February 2021. Legacy Aurora’s stockholders originally approved the 2017 Plan in December 2017 and approved the most recent amendment to the 2017 Plan in February 2021.
Aurora’s 2017 Plan allowed us to provide incentive stock options, within the meaning of Section 422 of the Code, nonstatutory stock options, stock appreciation rights, restricted stock awards and restricted stock units (each, an “award” and the recipient of such award, a “participant”) to eligible employees, directors, officers and consultants of Aurora and any parent or subsidiary of Aurora. Aurora will not grant any additional awards under the 2017 Plan following the Closing. However, the 2017 Plan will continue to govern the terms and conditions of the outstanding awards previously granted under the 2017 Plan.
As of July 9, 2021, the following awards were outstanding under Aurora’s 2017 Plan: RSUs covering 16,331,825 shares of Aurora’s common stock and stock options covering 40,964,278 shares of Aurora’s common stock.
Plan Administration
The administrator’s powers include the power to institute an exchange program under which (i) outstanding awards are surrendered or cancelled in exchange for awards of the same type (which may have higher or lower exercise prices and different terms), awards of a different type or cash, (ii) participants would have the opportunity to transfer any outstanding awards to a financial institution or other person or entity selected by the administrator or (iii) the exercise price of an outstanding award is increased or reduced. The administrator’s powers also include the power to prescribe, amend and rescind rules and regulations relating to the 2017 Plan, to modify or amend each award and to make all other determinations deemed necessary or advisable for administering the 2017 Plan.
Eligibility
Form S-8 promulgated
under the U.S. securities laws. Only Aurora’s employees or employees of Aurora’s parent or subsidiary companies are eligible to receive incentive stock options. Stock Options.
-108-
market value of Aurora’s common stock on the grant date, unless expressly determined in writing by the administrator on the option’s grant date. However, an incentive stock option granted to an individual who directly or by attribution owns more than 10% of the total combined voting power of all of Aurora’s classes of stock or of any Aurora’s parent or subsidiary may have a term of no longer than 5 years from the grant date and will have an exercise price of at least 110% of the fair market value of Aurora’s common stock on the grant date. In addition, to the extent that the aggregate fair market value of the shares with respect to which incentive stock options are exercisable for the first time by an employee during any calendar year (under all of Aurora’s plans and any parent or subsidiary) exceeds $100,000, such options will be treated as nonstatutory stock options. The administrator determines how a participant may pay the exercise price of an option, and the permissible methods are generally set forth in the applicable award agreement. If a participant’s status as a “service provider” (as defined in the 2017 Plan) terminates, that participant may exercise the vested portion of his or her option for the period of time stated in the applicable award agreement. Vested options generally will remain exercisable for three months or such longer or shorter period of time as set forth in the applicable award agreement if a participant’s status as a service provider terminates for a reason other than death or disability. If a participant’s status as a service provider terminates due to death or disability, vested options generally will remain exercisable for six months from the date of termination (or such other longer or shorter period as set forth in the applicable award agreement). In no event will an option remain exercisable beyond its original term. If a participant does not exercise his or her option within the time specified in the award agreement, the option will terminate. Except as described above, the administrator has the discretion to determine the post-termination exercisability periods for an option.
Restricted Stock Units
time-vesting
and a liquidity event vesting requirement, the latter of which is expected to be satisfied by the Closing, such that RSUs granted under the 2017 Plan that are time-vested at the time of the Closing are then expected to vest in full. Non-transferability
of Awards
Certain Adjustments
consolidation, split-up, spin-off, combination,
-109-
Dissolution or Liquidation
Merger and Change of Control
Clawback
Amendment and Termination
OURS Technology, Inc. 2017 Stock Incentive Plan
Aurora assumed awards granted under the OURS Technology, Inc. 2017 Stock Incentive Plan (the “OURS Plan”) in connection with its acquisition of OURS Technology, Inc. (“OURS”) in 2021. No awards have been granted or will be granted under the OURS Plan following the acquisition. However, the OURS Plan will continue to govern the terms and conditions of the outstanding awards previously granted under it.
The OURS Plan permitted the grant of incentive stock options, within the meaning of Section 422 of the Code, nonstatutory stock options, and stock purchase rights (each, an “award” and the recipient of such award, a “participant”) to eligible employees, consultants or outside directors of OURS and parents or subsidiary of OURS.
As of July 9, 2021, the following awards were outstanding under the OURS Plan: stock options covering 446,665 shares of Aurora’s common stock.
-110-
Plan Administration
Eligibility
Stock Options.
Non-transferability
of Awards
Certain Adjustments
a spin-off, a
reclassification, or a similar occurrence, the administrator, in order to prevent diminution or enlargement of the benefits or potential benefits intended to be made available under the OURS Plan, may (in its sole discretion) adjust the number, class, and price of stock covered by each outstanding award; provided, however, that the administrator shall make such adjustments to the extent required by applicable law. Except as provided in the OURS Plan, a service provider shall have no rights by reason of (i) any subdivision or consolidation of stocks or stock of any class, (ii) the payment of any dividend or (iii) any other increase or decrease in the number of shares of stock of any class. Any issuance by Aurora of shares of stock of any class, or securities convertible into shares of stock of any class, shall not affect, and no adjustment by reason thereof shall be made with respect to, the number of shares subject to an award, or the applicable exercise price or purchase price. -111-
Dissolution or Liquidation
Merger and Change of Control
Amendment and Termination
Blackmore Sensors & Analytics, Inc. 2016 Equity Incentive Plan
Aurora assumed awards granted under the Blackmore Sensors & Analytics, Inc. 2016 Equity Incentive Plan (the “Blackmore Plan”) in connection with its acquisition of Blackmore in 2019. No awards have been granted or will be granted under the Blackmore Plan following the acquisition. However, the Blackmore Plan will continue to govern the terms and conditions of the outstanding awards previously granted under it.
The Blackmore Plan permitted the grant of incentive stock options, within the meaning of Section 422 of the Code, nonstatutory stock options, stock appreciation rights, restricted stock awards and restricted stock units (each, an “award” and the recipient of such award, a “participant”) to eligible employees, directors, consultants, agents, advisors and independent contractors of Blackmore and related companies.
As of July 9, 2021, the following awards were outstanding under the Blackmore Plan: stock options covering 424,048 shares of Aurora’s common stock.
Plan Administration
Eligibility
Stock Options.
-112-
market value of Blackmore’s common stock on the grant date. However, an incentive stock option granted to an individual who directly or by attribution owned more than 10% of the total combined voting power of all of Blackmore’s classes of stock or of any Blackmore’s parent or subsidiary could have a term of no longer than 5 years from the grant date and must have an exercise price of at least 110% of the fair market value of Aurora’s common stock on the grant date. In addition, to the extent that the aggregate fair market value of the shares with respect to which incentive stock options are exercisable for the first time by an employee during any calendar year (under all of Blackmore’s plans and any parent or subsidiary) exceeds $100,000, such options will be treated as nonstatutory stock options. The administrator determines how a participant may pay the exercise price of an option, and the permissible methods are generally set forth in the applicable award agreement. Upon a participant’s “termination of service” (as defined in the Blackmore Plan), that participant may exercise the vested portion of his or her option for the period of time stated in the applicable award agreement. Vested options generally will remain exercisable for three months or such longer or shorter period of time as set forth in the applicable award agreement if a participant’s status as a service provider terminates for a reason other than retirement, death or disability. If the termination of service is due to retirement, death or disability, vested options generally will remain exercisable for one year from the date of termination. In no event will an option remain exercisable beyond its original term. If a participant does not exercise his or her option within the time specified in the award agreement, the option will terminate. Except as described above, the administrator has the discretion to determine the post-termination exercisability periods for an option.
Non-transferability
of Awards
Certain Adjustments
split, spin-off, combination
or exchange of shares, recapitalization, merger, consolidation, distribution to stockholders other than a normal cash dividend, or other change in Aurora’s corporate or capital structure results in (a) the outstanding shares of common stock, or any securities exchanged therefor or received in their place, being exchanged for a different number or kind of securities of Aurora or any other company or (b) new, different or additional securities of Aurora or any other company being received by the holders of shares of common stock, then the administrator shall make proportional adjustments in the number and kind of securities that are subject to any outstanding award and the per share price of such securities, without any change in the aggregate price to be paid. Dissolution or Liquidation
Merger and Change of Control
-113-
by the successor company, then such award will terminate upon effectiveness of the change of control. If and to the extent the successor company converts, assumes, substitutes for or replaces an outstanding award, all vesting restrictions and/or forfeiture provisions shall continue with respect to such award or any shares of the successor company or other consideration that may be received with respect to such awards.
Amendment and Termination
Aurora Innovation, Inc. 2021 Equity Incentive Plan
The Aurora Innovation, Inc. 2021 Equity Incentive Plan (the “2021 Plan”) was approved by the board of directors of Aurora and Legacy Aurora shareholders in 2021. The purposes of the 2021 Plan are to attract and retain personnel for positions with the Company and any of its parents or subsidiaries (such entities are referred to herein as the “company group”); to provide additional incentive to employees, directors, and consultants; and to promote the success of our business. These incentives will be provided through the grant of stock options, stock appreciation rights, restricted stock, restricted stock units, or performance awards as the administrator may determine.
Eligibility
The 2021 Plan provides for the grant of incentive stock options, within the meaning of Section 422 of the Code, to the Company’s employees and any parent and subsidiary corporations’ employees, and for the grant of nonstatutory stock options, restricted stock, restricted stock units, stock appreciation rights, performance units and performance shares to employees and consultants of the Company and the company group and directors of the Company. The actual number of individuals who will receive awards under the 2021 Plan cannot be determined in advance because the administrator has the discretion to select the participants on the basis of their service to Aurora and the company group. The Company and its subsidiaries has,
5 non-employee directors,
approximately 1,600 full-time employees (including our employee directors) and no part-time employees or consultants who are eligible to participate in the 2021 Plan. Authorized Shares
Subject to the adjustment provisions contained in the 2021 Plan and the evergreen provision described below, the maximum aggregate number of shares of Class A Common Stock that may be issued pursuant to awards under the 2021 Plan is (i) 120,000,000 shares of Class A Common Stock, plus (ii) any shares of Class A Common Stock subject to stock options, restricted stock units or other awards that were assumed in the Merger and terminate as a result of being unexercised or are forfeited to or repurchased by the Company, with the maximum number of shares to be added to the 2021 Plan pursuant to clause (ii) equal to 120,692,205 shares of Class A Common Stock. The 2021 Plan also includes an evergreen provision that provides for an automatic annual increase to the number of shares of Class A Common Stock available for issuance under the 2021 Plan on the first day of each fiscal year beginning with the 2022 fiscal year, equal to the least of:
| • | 120,900,000 shares of Class A Common Stock; |
| • | 5% of the total number of shares of all classes of Aurora common stock outstanding as of the last day of our immediately preceding fiscal year; or |
| • | Such lesser amount determined by the administrator. |
The 2021 Plan provides that the evergreen provision will terminate following the increase on the first day of the 2031 fiscal year. Generally, if an award expires or becomes unexercisable without having been exercised in
-114-
full, is surrendered under an exchange program described below, or, with respect to restricted stock, restricted stock units or performance awards, is forfeited to or reacquired by us due to the failure to vest, the unpurchased shares (or for awards other than options or stock appreciation rights, the forfeited or repurchased shares) that were subject to such awards will become available for future grant or sale under the 2021 Plan (unless it has terminated). With respect to stock appreciation rights, only shares actually issued will cease to be available. Shares that actually have been issued under the 2021 Plan under any award will not be returned to the 2021 Plan and will not become available for future distribution under the 2021 Plan; provided, however, that if shares issued pursuant to awards of restricted stock are repurchased by the Company or restricted stock units, performance shares or performance units are forfeited to Aurora, such shares will become available for future grant under the 2021 Plan. Shares used to pay the exercise price of an award or to satisfy the tax withholding obligations related to an award will become available for future grant or sale. To the extent an award is paid out in cash rather than shares, such cash payment will not reduce the number of shares available for issuance.
If any extraordinary dividend or other extraordinary distribution (whether in cash, shares, other securities, or other property), recapitalization, stock split, reverse stock split, reorganization, merger, consolidation,
split-up,
spin-off,
combination, reclassification, repurchase, or exchange of shares or other securities of Aurora or other change in the corporate structure of the Company affecting the shares occurs, the administrator, to prevent diminution or enlargement of the benefits or potential benefits intended to be provided under the 2021 Plan, will proportionately adjust the number and class of shares that may be delivered under the 2021 Plan; the number, class, and price of shares covered by each outstanding award; and the numerical share limits contained in the 2021 Plan. Plan Administration
The Board’s compensation committee administers the 2021 Plan and is referred to as the administrator. Different administrators may administer the 2021 Plan with respect to different groups of service providers. Board may retain the authority to concurrently administer the 2021 Plan and revoke the delegation of some or all authority previously delegated.
Subject to the terms of the 2021 Plan and applicable laws, the administrator generally will have the power in its sole discretion to make any determinations and perform any actions deemed necessary or advisable for administering the 2021 Plan. The administrator will have the power to administer the 2021 Plan, including but not limited to the power to construe and interpret the 2021 Plan and awards granted under the 2021 Plan, and determine the terms of awards, including but not limited to the exercise price (if any), the number of shares of Class A Common Stock subject to each award, the time when awards may vest or be exercised (including the ability to accelerate the vesting and exercisability of awards), and the form of consideration payable upon exercise, if applicable. The administrator may select the service providers to whom awards may be granted and approve forms of awards agreements under the 2021 Plan. The administrator will also have the authority to amend awards (including but not limited to the discretionary authority to extend the post-termination exercisability period of awards and to extend the maximum term of an option) and to temporarily suspend the exercisability of an award if the administrator deems such suspension to be necessary or appropriate for administrative purposes, subject to the provisions of the 2021 Plan. The administrator may institute and determine the terms and conditions of an exchange program under which (i) outstanding awards are surrendered or cancelled in exchange for awards of the same type (which may have higher or lower exercise prices and different terms), awards of a different type, and/or cash, (ii) participants have the opportunity to transfer any outstanding awards to a financial institution or other person or entity selected by the administrator, (iii) and/or the exercise price of an outstanding award is increased or reduced. Unless a participant is on an approved leave of absence, the administrator will have sole discretion to determine the date on which a participant stops actively providing services to Aurora or the company group. The administrator’s decisions, determinations, and interpretations are final and binding on all participants and any other holders of awards.
-115-
Stock Options
Options may be granted under the 2021 Plan. Subject to the provisions of the 2021 Plan, the administrator will determine the terms and conditions of options, including when such options vest and become exercisable (and the administrator will have the discretion to accelerate the time at which such options will vest or become exercisable). The per share exercise price of any option generally must be at least 100% of the fair market value of a share on the date of grant, and the term of an incentive stock option may not be more than 10 years. However, with respect to any incentive stock option granted to an individual who owns 10% of the voting power of all classes of stock of Aurora or any of its parent or subsidiary corporations, the term of such option must not exceed 5 years, and the per share exercise price of such incentive stock option must be at least 110% of the fair market value of a share on the grant date. After a participant’s service terminates, he or she generally may exercise the vested portion of his or her option for the period of time stated in his or her option agreement. In the absence of a specified time in the applicable award agreement, the option’s vested portion will generally remain exercisable for three months following the participant’s termination. Generally, the fair market value of a share is the closing sales price of a share on the relevant date as quoted on Nasdaq. An option generally may not be exercised later than the expiration of its term. Subject to the provisions of the 2021 Plan, the administrator will determine the other terms of options, including but not limited to the acceptable forms of consideration for exercising an option.
Stock Appreciation Rights
Stock appreciation rights may be granted under the 2021 Plan. Stock appreciation rights allow the recipient to receive the appreciation in the fair market value of Class A Common Stock between the exercise date and the date of grant. Subject to the provisions of the 2021 Plan, the administrator will determine the terms and conditions of stock appreciation rights, including when such rights vest and become exercisable (and the administrator will have the discretion to accelerate the time at which such rights will vest or become exercisable) and whether to pay any increased appreciation in cash, shares, or a combination of both. The per share exercise price of a stock appreciation right must be at least 100% of the fair market value a share on the date of grant with respect to United States taxpayers, and the maximum term of a stock appreciation right will be 10 years. After a participant’s service terminates, he or she generally may exercise the vested portion of his or her stock appreciation right for the period of time stated in his or her award agreement. A stock appreciation right generally may not be exercised later than its term.
Restricted Stock
Restricted stock may be granted under the 2021 Plan. Restricted stock awards are grants of shares that vest in accordance with terms and conditions established by the administrator. The administrator will determine the number of shares of restricted stock granted to any employee, director or consultant. The administrator may impose whatever conditions to vesting it determines to be appropriate (for example, the administrator may set restrictions based on the achievement of specific performance goals or continued service to us or members of the company group), and the administrator will have the discretion to accelerate the time at which any restrictions will lapse or be removed. Recipients of restricted stock awards generally will have voting rights and will accrue dividend equivalents that only are paid if and when the restrictions applicable to the restricted stock lapse, unless the administrator provides otherwise. Shares of restricted stock as to which the restrictions have not lapsed are subject to our right of repurchase or forfeiture.
Restricted Stock Units
Restricted stock units may be granted under the 2021 Plan. Restricted stock units are bookkeeping entries representing an amount equal to the fair market value of one share. The administrator will determine the terms and conditions of restricted stock units including the vesting criteria (which may include accomplishing specific performance criteria or continued service to us) and the form and timing of payment. The administrator will have the discretion to accelerate the time at which any restrictions will lapse or be removed and to settle earned restricted stock units in cash, shares, or a combination of both.
-116-
Performance Awards
Performance awards may be granted under the 2021 Plan. Performance awards are awards that will result in a payment to a participant only if objectives established by the administrator are achieved or the awards otherwise vest. The administrator will establish organizational or individual performance objectives in its discretion, which, depending on the extent to which they are met, will determine the value of the payout for the performance awards to be paid out to participants. The administrator will have the discretion to reduce or waive any performance objectives or other vesting provisions for performance awards. The administrator will have the discretion to pay earned performance awards in the form of cash, shares, or in some combination of both.
Non-Employee Directors
The 2021 Plan provides that any
non-employee
director, in any fiscal year, may not be paid, issued or granted cash compensation and equity awards (including any awards issued under the 2021 Plan) with an aggregate value of more than $750,000, increased to $1,000,000 in connection with the non-employee
director’s initial service, with the value of each equity award based on its grant date fair value. For purposes of this limitation, the grant date fair value is determined in accordance with GAAP. Any cash compensation or equity awards granted under the 2021 Plan to a non-employee director for his or her services as an employee, or for his or her services as a consultant (other than as a non-employee
director), will not count for purposes of the limitation. The maximum limit does not reflect the intended size of any potential compensation or equity awards to our non-employee
directors. Non-Transferability of Awards
Unless the administrator provides otherwise, the 2021 Plan generally does not allow for the transfer or disposal of awards and only the recipient of an award may exercise an award during his or her lifetime. Any unauthorized transfer will be void.
Dissolution or Liquidation.
If there is a proposed liquidation or dissolution of Aurora, the administrator will notify participants at such time before the effective date of such event as the administrator determines and all awards, to the extent that they have not been previously exercised, will terminate immediately before the consummation of such event.
Merger or Change in Control
The 2021 Plan provides that if there is a merger or a “change in control” (as defined under the 2021 Plan) of Aurora, each outstanding award will be treated as the administrator determines without a participant’s consent. Such treatment could include, without limitation, that an award be continued or substituted by the successor corporation, that vesting and exercisability of an award may accelerate automatically upon consummation of the transaction, or that the unvested portions of an award may be terminated without consideration. The administrator will not be obligated to treat all awards, portions of awards or participants similarly and may modify awards, subject to the provisions of the 2021 Plan.
With respect to awards held
by a non-employee director, in
the event of a change in control, the non-employee
director will fully vest in and have the right to exercise his or her options and/or stock appreciation rights, all restrictions on his or her restricted stock and restricted stock units will lapse, and, with respect to awards with performance-based vesting, all performance goals or other vesting criteria will be deemed achieved at 100% of target levels and all other terms and conditions met, unless specifically provided otherwise under the applicable award agreement or other written agreement with the participant. -117-
Forfeiture and Clawback
All awards granted under the 2021 Plan will be subject to recoupment under any clawback policy that we are required to adopt under applicable law or listing standards. In addition, the administrator may provide in an award agreement that the recipient’s rights, payments, and benefits with respect to such award shall be subject to reduction, cancellation, forfeiture, or recoupment upon the occurrence of specified events. In addition, the administrator may impose such other clawback, recovery or recoupment provisions in an award agreement as the administrator determines necessary or appropriate.
Amendment or Termination
The 2021 Plan became effective upon the Closing and will continue in effect until terminated by the administrator, however no incentive stock options may be granted after the ten (10) year anniversary of the adoption of the 2021 Plan by the RTPY Board, and the evergreen feature of the 2021 Plan will terminate following the increase on the first day of the 2031 fiscal year. In addition, the Company Board has the authority to amend, suspend, or terminate the 2021 Plan, but such action generally may not materially impair the rights of any participant without his or her written consent.
Retirement Benefits
We maintain basis through contributions to the 401(k) plan. Participants in our 401(k) plan are able to defer up to applicable annual Code limits. All participants’ interests in their deferrals are 100% vested when contributed. The 401(k) plan permits us to make matching contributions and profit sharing contributions to eligible participants. The named executive officers did not receive matching or profit-sharing contributions in 2020. The 401(k) plan is intended to qualify under Sections 401(a) and 501(a) of the Code. As a
a tax-qualified retirement
savings plan, or the 401(k) plan, for the benefit of our employees, including our named executive officers, who satisfy certain eligibility requirements. Our 401(k) plan provides eligible employees with an opportunity to save for retirement on a tax-advantaged basis.
Under our 401(k) plan, eligible employees may elect to defer a portion of their compensation, within the limits prescribed by the Code on a pre-tax or after-tax (Roth)
tax-qualified
retirement plan, pre-tax
contributions to the 401(k) plan and earnings on those pre-tax contributions
are not taxable to the employees until distributed from the 401(k) plan, and earnings on Roth contributions are not taxable when distributed from the 401(k) plan. Director Compensation of Aurora
Aurora currently has no formal agreement or program under which our directors receive compensation for their service on our board of directors or its committees. For the fiscal year ending December 31, 2020, we did not pay any compensation, make any equity awards
or non-equity awards
to, or pay any other compensation to any of the members of our board of directors in connection with their service on our board of directors. Chris Urmson receives no additional compensation for his service as a director and the compensation provided to him as an employee is set forth in the Summary Compensation Table above. Sterling Anderson and James Andrew Bagnell also receive no additional compensation for their service as directors and the compensation provided to them as employees is set forth in the section entitled “.”
Certain Relationships and Related Person Transactions—Aurora—Agreements with Employees, Directors and Officers
-118-
Fiscal 2020 Director Compensation Table
The following table sets forth all of the compensation awarded to, earned by or paid to
our non-employee directors
during fiscal 2020. | Name |
Fees Earned or Paid in Cash ($) |
Stock Awards ($)(1) |
Option Awards ($)(1) |
Total ($) |
||||||||||||
| Carl Eschenbach |
— | — | — | — | ||||||||||||
| Reid Hoffman |
— | — | — | — | ||||||||||||
| Ian Smith |
— | — | — | — | ||||||||||||
| Mike Volpi |
— | — | — | — | ||||||||||||
| (1) | The aggregate number of stock and option awards outstanding for each non-employee director on December 31, 2020 was 0. |
-119-
PRINCIPAL AND SELLING SECURITYHOLDERS
The following table sets forth:
| • | the beneficial ownership of our capital stock as of November 3, 2021 (unless otherwise specified), as adjusted to reflect the Class A Common Stock that may be sold from time to time pursuant to this prospectus, for: (i) each person or group of affiliated persons known to us to be the beneficial owner of more than 5% of outstanding Class A Common Stock or Class B Common Stock; (ii) each of our named executive officers and directors; and (iii) all of our executive officers and directors as a group. |
| • | certain information concerning the shares of Class A common stock and private placement warrants that may be offered from time to time by each Selling Securityholder under this prospectus. |
This prospectus relates to the resale of up to 399,468,805 shares of Class A Common Stock, consisting of (i) up to 100,000,000 PIPE shares; (ii) up to 4,029,344 shares of Affiliate Class A Stock; (iii) up to 6,883,086 shares of Sponsor Stock; and (iv) up to 288,556,375 Registration Rights Shares.
The Selling Securityholders may from time to time offer and sell any or all of the shares of Class A Common Stock and Warrants set forth below pursuant to this prospectus and any accompanying prospectus supplement. When we refer to the “Selling Securityholders” in this prospectus, we mean the persons listed in the table below, and the pledgees, donees, transferees, assignees, successors, designees and others who later come to hold any of the Selling Securityholders’ interest in the Class A common stock or warrants other than through a public sale.
The following table sets forth, as of the date of this prospectus, the names of the Selling Securityholders, and the aggregate number of shares of common stock and private placement warrants that the Selling Securityholders may offer pursuant to this prospectus. The table does not include the issuance by us of up to 12,218,750 shares of Class A Common Stock upon the exercise of the public warrants, each of which is also covered by this prospectus. For purposes of this table, we have assumed that the Selling Securityholders will have sold all of the securities covered by this prospectus upon the completion of the offering.
We cannot advise you as to whether the Selling Securityholders will in fact sell any or all of such securities. In particular, the Selling Securityholders identified below may have sold, transferred or otherwise disposed of all or a portion of their securities after the date on which they provided us with information regarding their securities. Any changed or new information given to us by the Selling Securityholders, including regarding the identity of, and the securities held by, each Selling Securityholder, will be set forth in a prospectus supplement or amendments to the registration statement of which this prospectus is a part, if and when necessary.
Please see the section entitled “” for further information regarding the Selling Securityholders’ method of distributing these securities.
Plan of Distribution
We have determined beneficial ownership in accordance with the rules and regulations of the SEC and the information is not necessarily indicative of beneficial ownership for any other purpose. Except as indicated by the footnotes below, we believe, based on information furnished to us, that the persons and entities named in the table below have sole voting and sole investment power with respect to all shares that they beneficially own, subject to applicable community property laws.
-120-
Unless otherwise indicated, the address of each beneficial owner listed in the table below is c/o Aurora Innovation, Inc., 50 33rd St, Pittsburgh PA, 15201.
Common Stock Beneficially Owned Prior to Offering |
|
|
Common Stock Beneficially Owned After Offering |
|
Private Placement Warrants |
|||||||||||||||||||||||||||||||||||||||||||||||||||||||||||
| Name of Beneficial Owner (1)
|
Number of Shares of Class A Common Stock Beneficially Owned |
% of Class A Common Stock Beneficially Owned |
Number of Shares of Class B Common Stock Beneficially Owned |
% of Class B Common Stock Beneficially Owned |
% of Total Voting Power Prior to Offering **
|
Number of shares of Class A Common Stock Registered for Sale Hereby |
Number of Shares of Class A Common Stock Beneficially Owned |
% of Class A Common Stock Beneficially Owned |
Number of Shares of Class B Common Stock Beneficially Owned |
% of Class B Common Stock Beneficially Owned |
% of Total Voting Power After Offering **
|
Number Beneficially Owned Prior to Offering |
% Beneficially Owned Prior to Offering |
Number of Warrants Registered for Sale Hereby |
Number Beneficially Owned After Offering |
% Beneficially Owned After Offering |
||||||||||||||||||||||||||||||||||||||||||||||||
| Greater than 5% Holders |
||||||||||||||||||||||||||||||||||||||||||||||||||||||||||||||||
| Neben Holdings LLC (2)
|
300,936,375 | 46.81 | % | — | — | 5.52 | % | 300,936,375 | — | — | — | — | — | — | — | — | ||||||||||||||||||||||||||||||||||||||||||||||||
| Entities affiliated with Sequoia Capital (3)
|
500,000 | * | 35,239,761 | 7.33 | % | 6.47 | % | 35,739,761 | — | — | — | — | — | — | — | |
— |
|
||||||||||||||||||||||||||||||||||||||||||||||
| Entities affiliated with Greylock (4)
|
— | — | 28,193,946 | 5.86 | % | 5.17 | % | 28,193,946 | — | — | — | — | — | — | — | — | ||||||||||||||||||||||||||||||||||||||||||||||||
| Entities affiliated with Index Ventures (5)
|
500,000 | * | 37,911,648 | 7.88 | % | 6.96 | % | 38,411,648 | — | — | — | — | — | — | — | — | ||||||||||||||||||||||||||||||||||||||||||||||||
| Amazon.com NV Investment Holdings LLC (6)
|
— | — | 35,239,761 | 7.33 | % | 6.46 | % | 35,239,761 | — | — | — | — | — | — | — | — | ||||||||||||||||||||||||||||||||||||||||||||||||
| Entities affiliated with T. Rowe Price Associates, Inc. (7)
|
13,850,000 | 2.15 | % | 35,077,106 | 7.29 | % | 6.69 | % | 48,927,106 | — | — | — | — | — | — | — | — | |||||||||||||||||||||||||||||||||||||||||||||||
| Entities affiliated with Toyota Motor Corporation (8)
|
47,561,589 | 7.40 | % | 373,891 | * | * | 373,891 | 47,561,589 | 7.40 | % | — | — | * | — | — | — | ||||||||||||||||||||||||||||||||||||||||||||||||
| SoftBank Vision Fund (AIV M2) L.P. (9)
|
39,417,358 | 6.13 | % | — | — | * | 0 | 39,417,358 | 6.13 | % | — | — | * | — | — | — | ||||||||||||||||||||||||||||||||||||||||||||||||
| Named Executive Officers and Directors |
— | — | — | |||||||||||||||||||||||||||||||||||||||||||||||||||||||||||||
| Chris Urmson (10)
|
— | — | 145,831,739 | 30.31 | % | 26.74 | % | 145,831,739 | — | — | — | — | — | — | — | — | ||||||||||||||||||||||||||||||||||||||||||||||||
| Richard Tame (11)
|
651,252 | * | * | * | 651,252 | — | — | — | — | — | — | — | — | |||||||||||||||||||||||||||||||||||||||||||||||||||
| William Mouat (12)
|
3,442,814 | * | * | * | 3,442,814 | — | — | — | — | — | — | — | — | |||||||||||||||||||||||||||||||||||||||||||||||||||
| Sterling Anderson (13)
|
— | — | 52,629,503 | 10.94 | % | 9.65 | % | 52,629,503 | — | — | — | — | — | — | — | — | ||||||||||||||||||||||||||||||||||||||||||||||||
| James Andrew Bagnell (14)
|
— | — | 47,304,449 | 9.83 | % | 8.67 | % | 47,304,449 | — | — | — | — | — | — | — | — | ||||||||||||||||||||||||||||||||||||||||||||||||
| Reid Hoffman (15)
|
8,557,805 | 1.33 | % | 28,976,034 | 6.02 | % | 5.47 | % | 2,456,807 | — | — | — | — | — | 8,900,000 | 100 | % | 8,900,000 | — | — | ||||||||||||||||||||||||||||||||||||||||||||
| Dara Khosrowshahi (16)
|
— | — | — | — | — | — | — | — | — | — | — | — | — | — | ||||||||||||||||||||||||||||||||||||||||||||||||||
| Michelangelo Volpi |
— | — | — | — | — | — | — | — | — | — | — | — | — | — | ||||||||||||||||||||||||||||||||||||||||||||||||||
| Carl M. Eschenbach (16)
|
— | — | — | — | — | — | — | — | — | — | — | — | — | — | ||||||||||||||||||||||||||||||||||||||||||||||||||
| Brittany Bagley |
— | — | — | — | — | — | — | — | — | — | — | — | — | — | ||||||||||||||||||||||||||||||||||||||||||||||||||
| All directors and executive officers as a group (ten individuals) |
12,651,871 | 1.97 | % | 274,741,725 | 57.11 | % | 45.95 | % | 252,316,564 | — | — | — | — | — | — | — | — | |||||||||||||||||||||||||||||||||||||||||||||||
| Other Selling Securityholders |
||||||||||||||||||||||||||||||||||||||||||||||||||||||||||||||||
| Reinvent Sponsor Y LLC (17)
|
6,883,086 | 1.07 | % | — | * | 6,883,086 | — | — | — | — | — | 8,900,000 | 100 | % | 8,900,000 | — | — | |||||||||||||||||||||||||||||||||||||||||||||||
| Entities affiliated with Allen & Company LLC (18)
|
9,266,996 | 1.44 | % | — | — | * | 1,000,000 | 8,266,996 | 1.286 | % | — | — | * | — | — | |||||||||||||||||||||||||||||||||||||||||||||||||
| Entities affiliated with Baillie Gifford (19)
|
15,000,000 | 2.33 | % | 6,578,060 | 1.37 | % | * | 21,578,060 | — | — | — | — | — | — | — | |||||||||||||||||||||||||||||||||||||||||||||||||
| CPP Investment Board PMI-3 Inc.(20)
|
2,500,000 | * | 5,873,275 | 1.22 | % | * | 8,373,275 | — | — | — | — | — | — | — | ||||||||||||||||||||||||||||||||||||||||||||||||||
| Entities affiliated with Fidelity (21)
|
5,000,000 | * | 5,873,273 | 1.22 | % | * | 10,873,273 | — | — | — | — | — | — | — | ||||||||||||||||||||||||||||||||||||||||||||||||||
| Ghisallo Master Fund LP (22)
|
1,000,000 | * | — | — | * | 1,000,000 | — | — | — | — | — | — | — | |||||||||||||||||||||||||||||||||||||||||||||||||||
| Hedosophia Group Limited (23)
|
5,200,000 | * | — | — | * | 5,200,000 | — | — | — | — | — | — | — | |||||||||||||||||||||||||||||||||||||||||||||||||||
| Entities affiliated with Morgan Stanley (24)
|
15,000,000 | 2.33 | % | — | — | * | 15,000,000 | — | — | — | — | — | — | — | ||||||||||||||||||||||||||||||||||||||||||||||||||
| PACCAR Inc. (25)
|
1,000,000 | * | — | — | * | 1,000,000 | — | — | — | — | — | — | — | |||||||||||||||||||||||||||||||||||||||||||||||||||
| Entities affiliated with PrimeCap (26)
|
10,450,000 | 1.63 | % | — | — | * | 10,450,000 | — | — | — | — | — | — | — | ||||||||||||||||||||||||||||||||||||||||||||||||||
| Entities affiliated with Soros (27)
|
2,000,000 | * | — | — | * | 2,000,000 | — | — | — | — | — | — | — | |||||||||||||||||||||||||||||||||||||||||||||||||||
| Volvo Autonomous Solutions AB (28)
|
500,000 | * | — | — | * | 500,000 | — | — | — | — | — | — | — | |||||||||||||||||||||||||||||||||||||||||||||||||||
| XN Exponent Master Fund (29)
|
6,500,000 | 1.01 | % | — | — | * | 6,500,000 | — | — | — | — | — | — | — | ||||||||||||||||||||||||||||||||||||||||||||||||||
| Reprogrammed Interchange LLC (30)
|
1,000,000 | * | — | — | * | 1,000,000 | — | — | — | — | — | — | — | |||||||||||||||||||||||||||||||||||||||||||||||||||
| TP Trading II LLC (31)
|
5,000,000 | * | — | — | * | 5,000,000 | — | — | — | — | — | — | — | |||||||||||||||||||||||||||||||||||||||||||||||||||
| Michael Thompson (32)
|
430,000 | * | 1,174,642 | * | * | 430,000 | — | — | — | — | — | — | — | |||||||||||||||||||||||||||||||||||||||||||||||||||
| Wai-Yen Lau |
70,000 | * | — | — | * | 70,000 | — | — | — | — | — | — | — | |||||||||||||||||||||||||||||||||||||||||||||||||||
| Anne-Marie Slaughter (33)
|
30,000 | * | — | — | * | 30,000 | — | — | — | — | — | — | — | |||||||||||||||||||||||||||||||||||||||||||||||||||
| Colleen McCreary (34)
|
30,000 | * | — | — | * | 30,000 | — | — | — | — | — | — | — | |||||||||||||||||||||||||||||||||||||||||||||||||||
| Karen Francis (35)
|
30,000 | * | — | — | * | 30,000 | — | — | — | — | — | — | — | |||||||||||||||||||||||||||||||||||||||||||||||||||
| Katharina Borchert (36)
|
30,000 | * | — | — | * | 30,000 | — | — | — | — | — | — | — | |||||||||||||||||||||||||||||||||||||||||||||||||||
| Workplay Ventures LLC (37)
|
600,000 | * | — | — | * | 600,000 | ||||||||||||||||||||||||||||||||||||||||||||||||||||||||||
| MJP DT Holdings LLC (38)
|
400,000 | * | — | — | * | 400,000 | ||||||||||||||||||||||||||||||||||||||||||||||||||||||||||
-121-
| * | Less than 1% |
| ** | Percentage of total voting power represents voting power with respect to all shares of Class A Common Stock and Class B Common Stock, as a single class. Each share of Class B Common Stock is entitled to ten votes per share and each share of Class A Common Stock is entitled to one vote per share. For more information about the voting rights of Common Stock, see the section below titled “Description of Capital Stock.” |
| (1) | Unless otherwise noted, the business address of each of the following entities or individuals is c/o Aurora Innovation, Inc., Attention: General Counsel, 50 33 rd St, Pittsburgh PA, 15201. |
| (2) | Consists of 300,936,375 shares of Class A Common Stock held by Neben Holdings, LLC. Neben Holdings, LLC is a wholly owned indirect subsidiary of Uber Technologies, Inc., a publicly traded company. The registered address of Uber Technologies, Inc. is 1515 3rd Street, San Francisco, CA 94158. |
| (3) | Consists of (i) 11,746,572 shares of Class B Common Stock held by Sequoia Capital U.S. Growth Fund VIII, L.P. (“GF VIII”), (ii) 23,493,189 shares of Class B Common Stock held by Sequoia Capital Global Growth Fund III—Endurance Partners, L.P. (“GGF III”), (iii) 165,000 shares of Aurora Class A common stock held by GF VIII and (iv) 335,000 shares of Class A Common Stock held by GGF III. SC US (TTGP), Ltd. is (i) the general partner of SCGGF III–Endurance Partners Management, L.P., which is the general partner of GGF III, and (ii) the general partner of SC U.S. Growth VIII Management, L.P., which is the general partner of GF VIII. As a result, SC US (TTGP), Ltd. may be deemed to share voting and dispositive power with respect to the shares held by the Sequoia Capital entities. The directors and stockholders of SC US (TTGP), Ltd. who participate in decisions to exercise voting and investment discretion with respect to GF VIII include Carl Eschenbach, a member of the Board. In addition, the directors and stockholders of SC US (TTGP), Ltd. who exercise voting and investment discretion with respect to GGF III are Douglas M. Leone and Roelof Botha. As a result, and by virtue of the relationships described in this paragraph, Messrs. Leone and Botha may be deemed to share voting and dispositive power with respect to the shares held by GGF III. Mr. Eschenbach expressly disclaims beneficial ownership of the shares held by the Sequoia Capital entities. The address for each of the Sequoia Capital entities is 2800 Sand Hill Road, Suite 101, Menlo Park, CA 94025. |
| (4) | Consists of (i) 25,374,548 shares of Class B Common Stock held by Greylock 15 Limited Partnership (“Greylock 15”), (ii) 1,409,699 shares of Class B Common Stock held by Greylock 15 Principals Limited Partnership (“Greylock Principals”) and (iii) 1,409,699 shares of Class B Common Stock held by Greylock 15-A Limited Partnership (“Greylock 15-A”). Greylock 15 GP LLC (“Greylock LLC”), is the general partner of each of Greylock 15, Greylock Principals, and Greylock 15-A. Reid Hoffman, a member of the Board, Asheem Chandna, James Slavet, Donald Sullivan, and David Sze are the senior managing members of Greylock LLC. The managing members of Greylock LLC may be deemed to share the power to vote or direct the voting of and to dispose or direct the disposition of the Class B Common Stock beneficially owned by Greylock 15, Greylock Principals, and Greylock 15-A. Each of the managing members of Greylock LLC disclaims beneficial ownership of all securities other than those he owns directly, if any, or by virtue of his indirect pro rata interest, as a managing member of Greylock LLC, in the Class B Common Stock owned by Greylock 15, Greylock Principals, and/or Greylock 15-A. The business address for each of these entities and individuals is 2550 Sand Hill Road, Suite 200, Menlo Park, CA 94025. |
| (5) | Consists of (i) 37,342,994 shares of Class B Common Stock held by Index Ventures Growth III (Jersey), L.P. (“Index Growth III”), (ii) 568,654 shares of Class B Common Stock held by Yucca (Jersey) SLP (“Yucca”), (iii) 492,500 shares of Class A Common Stock held by Index Growth III and (iv) 7,500 shares of Class A Common Stock held by Yucca. Index Venture Growth Associates III Limited (“IVGA III”) is the managing general partner of Index Growth III and may be deemed to have voting and dispositive power over the shares held by such fund. Yucca is the administrator of the Index co-investment vehicles that are contractually required to mirror the relevant Index funds’ investment, and IVGA III may be deemed to have voting and dispositive power over its allocation of shares held by Yucca. The address of the entities mentioned in this footnote is 5th Floor, 44 Esplanade, St. Helier, Jersey JE1 3FG, Channel Islands. |
| (6) | Consists of 35,239,761 shares of Class B Common Stock held by Amazon.com NV Investment Holdings LLC. Amazon.com NV Investment Holdings LLC, a wholly owned subsidiary of Amazon.com, Inc., a publicly traded company. The registered address of Amazon.com, Inc. is 410 Terry Avenue North, Seattle, WA 98109. |
| (7) | Consists of 35,077,106 shares of Class B Common Stock and 13,850,000 shares of Class A Common Stock beneficially owned by funds and accounts (severally and not jointly) that are advised or subadvised by T. Rowe Price Associates, Inc. (“TRPA”). TRPA, as investment adviser, has dispositive and voting power with respect to the shares held by these funds and accounts. For purposes of the Securities Exchange Act of 1934, TRPA may be deemed to be the beneficial owner of these shares; however, TRPA expressly disclaims that it is, in fact, the beneficial owner of such securities. TRPA is a wholly owned subsidiary of T. Rowe Price Group, Inc., which is a publicly traded financial services holding company. The principal business address of TRPA is 100 East Pratt Street, Baltimore, MD 21202. |
| (8) | Consists of (i) 47,348,178 shares of Class A Common Stock held by Toyota Motor Corporation, a publicly traded company, (ii) 373,891 shares of Class B Common Stock held by Toyota A.I. Ventures Fund I, L.P. and (iii) 213,411 shares of Class A Common Stock held by Toyota A.I. Ventures Fund I, L.P. Toyota Motor Corporation has dispositive control over the shares held by Toyota A.I. Ventures Fund I, L.P. and may be deemed to beneficially own such shares. The business address for Toyota Motor Corporation is 4-7-1 Nakamura-ku, Nagoya, Aichi 450-8171, Japan. |
| (9) | Consists of 39,417,358 shares of Class A Common Stock held by SoftBank Vision Fund (AIV M2) L.P. (“SVF”). SVF GP (Jersey) Limited (“SVF GP”), is the general partner of SVF. SB Investment Advisers (UK) Limited (“SBIA UK”), has been appointed as alternative investment fund manager (“AIFM”), and is exclusively responsible for managing SVF in accordance with the Alternative Investment Fund Managers Directive and is authorized and regulated by the UK Financial Conduct Authority accordingly. As AIFM of SVF, SBIA UK is exclusively |
-122-
| responsible for making all decisions related to the acquisition, structuring, financing, voting and disposal of SVF’s investments. SVF GP and SBIA UK are both wholly owned by SoftBank Group Corp. The address of SVF is 251 Little Falls Drive, Wilmington, Delaware 19808. |
| (10) | Consists of 145,831,739 shares of Class B Common Stock held by Mr. Urmson. |
| (11) | Consists of 651,252 shares of Class A Common Stock issuable upon exercise of Aurora Options, including 244,219 shares of Class A Common Stock issuable upon exercise of Aurora Options exercisable within 60 days from November 3, 2021. |
| (12) | Consists of (i) 3,354,625 shares of Class A Common Stock held by Mr. Mouat, (ii) 88,190 shares of Class A Common Stock issuable upon exercise of Aurora Options, including 74,622 shares of Class A Common Stock issuable upon exercise of Aurora Options exercisable within 60 days from November 3, 2021 and (iii) 81,406 shares of Class A Common Stock issuable upon settlement of Aurora RSU Awards, including 13,567 shares of Class A Common Stock issuable upon settlement of Aurora RSU Awards that will vest within 60 days from November 3, 2021. |
| (13) | Consists of (i) 52,627,338 shares of Class B Common Stock held by Mr. Anderson and (ii) 2,170 shares of Class B Common Stock held by the Anderson 2021 GRAT, of which Mr. Anderson is trustee. |
| (14) | Consists of 47,304,449 shares of Class B Common Stock held by Mr. Bagnell. |
| (15) | Consists of (i) 6,883,086 shares of Class A Common Stock held by Reinvent Sponsor Y LLC, (ii) 1,000,000 shares of Class A Common Stock held by Reprogrammed Interchange LLC, (iii) 674,719 shares of Class A Common Stock held by Programmable Exchange LLC, (iv) 782,088 shares of Class B Common Stock held by Thigmotropism LLC, (v) shares of Class B Common Stock held by the Greylock entities referenced in footnote (4) above and (vi) 8,900,000 shares of Class A Common Stock issuable upon conversion of the Private Placement Warrants held by Reinvent Sponsor Y LLC. Mr. Hoffman is an equityholder of Reinvent Sponsor Y LLC. Mr. Hoffman may be deemed to beneficially own shares held by Reinvent Sponsor Y LLC by virtue of his shared control over the Sponsor. Mr. Hoffman may be deemed to beneficially own shares held by Reprogrammed Interchange LLC, Programmable Exchange LLC and Thigmotropism LLC by virtue of his voting and investment power over such shares. |
| (16) | Mr. Eschenbach is a general partner at Sequoia Capital Operations, LLC. Mr. Eschenbach disclaims beneficial ownership of all shares held by the Sequoia Capital entities referred to in footnote (3) above. |
| (17) | Consists of (i) 6,883,086 shares of Class A Common Stock and (ii) 8,900,000 shares of Class A Common Stock issuable upon conversion of the Private Placement Warrants, which are registered for issuance and resale in this prospectus. The business address of Reinvent Sponsor Y LLC is 215 Park Avenue, Floor 11, New York, New York 10003. |
| (18) | Consists of 1,000,000 shares of Class A Common stock beneficially owned by funds and accounts (severally and not jointly) of which Allen & Company LLC serves as managing member. The selling stockholder is controlled by the members of Allen & Company LLC. Ian Smith, a Managing Director of Allen & Company LLC, is a former director of the Company. Mr. Smith resigned from the Company’s board in 2021. The address for notice is 711 Fifth Avenue, New York, New York 10022. |
| (19) | Baillie Gifford & Co. has been appointed to act for and on behalf of as investment manager for Baillie Gifford US Growth Trust PLC (“US Growth Trust”) and Scottish Mortgage Investment Trust PLC (“Scottish Mortgage Trust”) with full voting and investment power. The address of each of US Growth Trust and Scottish Mortgage Trust is c/o Baillie Gifford, Calton Square, 1 Greenside Row, Edinburgh EH1 3AN, Scotland, United Kingdom. |
| (20) | The natural control person and authorized signatory of CPP Investment Board PMI-3 Inc (“CPPIB”) is Leon Pederson. The address for CPPIB is One Queen Street East, Suite 2500, Toronto, ON, M5C 2W5 Canada. |
| (21) | These securities are managed by direct or indirect subsidiaries of FMR LLC. Abigail P. Johnson is a Director, the Chairman, the Chief Executive Officer and the President of FMR LLC. Members of the Johnson family, including Abigail P. Johnson, are the predominant owners, directly or through trusts, of Series B voting common shares of FMR LLC, representing 49% of the voting power of FMR LLC. The Johnson family group and all other Series B shareholders have entered into a shareholders’ voting agreement under which all Series B voting common shares will be voted in accordance with the majority vote of Series B voting common shares. Accordingly, through their ownership of voting common shares and the execution of the shareholders’ voting agreement, members of the Johnson family may be deemed, under the Investment Company Act of 1940, to form a controlling group with respect to FMR LLC. Neither FMR LLC nor Abigail P. Johnson has the sole power to vote or direct the voting of the shares owned directly by the various investment companies registered under the Investment Company Act (“Fidelity Funds”) advised by Fidelity Management & Research Company (“FMR Co”), a wholly owned subsidiary of FMR LLC, which power resides with the Fidelity Funds’ Boards of Trustees. Fidelity Management & Research Company carries out the voting of the shares under written guidelines established by the Fidelity Funds’ Boards of Trustees. The address is 140 Broadway, New York, NY 10005. |
| (22) | Michael Germino is the natural control person and authorized signatory for the securities held by Ghisallo Master Fund LP. The address for notice is 190 Elgin Avenue, George Town, Grand Cayman, CI KY 1-9008. |
| (23) | The board of directors of Hedosophia Public Investments Limited comprises Ian Osborne, Iain Stokes, Rob King and Trina Le Noury and each director has shared voting and dispositive power with respect to the securities held by Hedosophia Public Investments Limited. Each of them disclaims beneficial ownership of the securities held by Hedosophia Public Investments Limited. The address of Hedosophia Public Investments Limited is Trafalgar Court, Les Banques, St Peter Port, Guernsey GY1 3QL. |
-123-
| (24) | Consists of 15,000,000 shares of Class A Common Stock beneficially owned by funds and accounts (severally and not jointly) of which Morgan Stanley Investment Management Inc. (“MSIM”) serves as investment manager or adviser. MSIM, as investment manager or adviser of Selling Securityholder, holds the power to vote or dispose of the securities mentioned here. The address of MSIM is 522 Fifth Avenue, New York, NY 10036. |
| (25) | The natural control persons are the directors of PACCAR Inc. For more information, please see PACCAR Inc.’s public filings with the SEC. The address for notices is 777 106th Ave N.E., Bellevue, WA 98004. |
| (26) | Consists of 10,450,000 shares of Class A Common Stock beneficially owned by funds and accounts (severally and not jointly) controlled by PRIMECAP Management Company. The address of PRIMECAP Management Company is 177 East Colorado Blvd., 11 th Floor, Pasadena, CA 91105. |
| (27) | Consists of 2,000,000 shares of Class A Common Stock beneficially owned by funds and accounts (severally and not jointly) of which Soros Fund Management LLC (“SFM LLC”) serves as principal investment manager. As such, SFM LLC has been granted investment discretion over portfolio investments, including the securities, held for the account of these entities. George Soros serves as Chairman of SFM LLC and has sole discretion to replace FPR Manager LLC, the manager of SFM LLC. The address of SFM LLC is 250 West 55 th Street, 29th Floor, New York, NY 10019. |
| (28) | Volvo AB is the ultimate parent holding company of Volvo Autonomous Solutions AB. On behalf of Volvo Autonomous Solutions AB, the executive officers and the board of directors of Volvo Autonomous Solutions AB have voting and investment power over the shares held by Volvo Autonomous Solutions AB, which is the registered holders of the securities. Volvo AB and such executive officers and directors of Volvo Autonomous Solutions AB expressly disclaim beneficial ownership of all securities held by Volvo Autonomous Solutions AB. The address for notice is CampX, Praestvaegen 12, 41875 Gothenburg, Sweden. |
| (29) | XN LP serves as investment manager to XN Exponent Master Fund LP (the “Fund”) and has discretionary authority to make investment decisions and determine how to vote any securities held by the Fund. The general partner of XN LP is XN Management GP LLC, which is indirectly controlled by Gaurav Kapadia. The address for notice is 412 West 15th Street, 13th Floor, New York, NY 10011. |
| (30) | The manager of Reprogrammed Interchange LLC is Frank Huang. Mr. Hoffman, a member of our board of directors, may be deemed the beneficial owner of the shares of common stock held by Reprogrammed Interchange LLC. The business address of Reprogrammed Interchange LLC is 1415 Commercial Avenue #105, Anacortes, WA 98221. |
| (31) | The securities of the Company set forth herein are directly beneficially owned by TP Trading II LLC (“TP Trading II”). TP Trading II is an affiliate of Third Point LLC (“Third Point”) and holds the securities listed herein as nominee for funds managed and/or advised by Third Point and not in its individual capacity. Daniel S. Loeb is the Chief Executive Officer of Third Point. By reason of the provisions of Rule 13d-3 under the Securities Exchange Act of 1934, as amended, Third Point and Mr. Loeb may be deemed to be the beneficial owners of the securities beneficially owned by TP Trading II. Third Point and Mr. Loeb hereby disclaim beneficial ownership of all such securities, except to the extent of any indirect pecuniary interest therein. The business address for Mr. Loeb and the entities identified in this footnote is c/o Third Point LLC, 55 Hudson Yards, 51st Floor, New York, NY 10001. |
| (32) | Consists of (i) 430,000 shares of Class A common stock held directly by Mr. Thompson and (ii) 1,174,642 shares of Class B common stock held by Reinvent Capital Fund LP. Mr. Thompson may be deemed a beneficial owner of securities held by Reinvent Capital Fund LP by virtue of his shared control over Reinvent Capital Fund LP. Mr. Thompson disclaims beneficial ownership of the securities held by Reinvent Capital Fund LP, except to the extent of his pecuniary interest therein. Mr. Thompson was Chief Executive Officer, Chief Financial Officer and a director of Reinvent Technology Partners Y prior to the consummation of the Business Combination. The business address of Mr. Thompson is c/o Reinvent, 215 Park Avenue, Floor 11, New York, New York 10003. |
| (33) | Ms. Slaughter was a member of the board of directors of Reinvent Technology Partners Y prior to the consummation of the Business Combination. The business address of Ms. Slaughter is c/o Reinvent, 215 Park Avenue, Floor 11, New York, New York 10003. |
| (34) | Ms. McCreary was a member of the board of directors of Reinvent Technology Partners Y prior to the consummation of the Business Combination. The business address of Ms. McCreary is c/o Reinvent, 215 Park Avenue, Floor 11, New York, New York 10003. |
| (35) | Ms. Francis was a member of the board of directors of Reinvent Technology Partners Y prior to the consummation of the Business Combination. The business address of Ms. Francis is c/o Reinvent, 215 Park Avenue, Floor 11, New York, New York 10003. |
| (36) | Ms. Borchert was a member of the board of directors of Reinvent Technology Partners Y prior to the consummation of the Business Combination. The business address of Ms. Borchert is c/o Reinvent, 215 Park Avenue, Floor 11, New York, New York 10003. |
| (37) | The manager of Workplay Ventures LLC is Gretchen Lucas. Workplay Ventures LLC is wholly owned by 4D Revocable Trust. Mark J. Pincus is the Trustee of 4D Revocable Trust. Mr. Pincus was a member of the board of directors of Reinvent Technology Partners Y prior to the consummation of the Business Combination. The business address of MJP DT Holdings LLC is 3450 Sacramento St. #722, San Francisco, CA 94118. |
| (38) | The manager of MJP DT Holdings LLC is Gretchen Lucas. MJP DT Holdings LLC is wholly owned by MJP 2020 Delaware Irrevocable Trust, the trustee of which is J.P. Morgan Trust Company of Delaware. Mark J. Pincus has the right to remove and replace the trustee of MJP 2020 Delaware Irrevocable Trust. Mr. Pincus was a member of the board of directors of Reinvent Technology Partners Y prior to the consummation of the Business Combination. The business address of MJP DT Holdings LLC is 3450 Sacramento St. #722, San Francisco, CA 94118. |
124
DESCRIPTION OF CAPITAL STOCK
The following description summarizes certain important terms of our capital stock as of the date of this prospectus as specified in our Certificate of Incorporation and Bylaws. Because the following description is only a summary, it does not contain all the information that may be important to you. For a complete description of the matters set forth in this section titled “,” you should refer to the Certificate of Incorporation, the Bylaws, the Warrant Agreement, and the Registration Rights Agreement, which are included as exhibits to the registration statement of which this prospectus is a part, and to the applicable provisions of Delaware law.
Description of Capital Stock
General
The authorized capital stock of Aurora consists of 52,000,000,000 shares of capital stock, $0.00001 par value per share, of which:
| • | 50,000,000,000 shares are designated as Class A Common Stock; |
| • | 1,000,000,000 shares are designated as Class B Common Stock; and |
| • | 1,000,000,000 shares are designated as preferred stock. |
As of November 3, 2021, there were 642,869,548 shares of Class A Common Stock outstanding, 481,107,977 shares of Class B Common Stock outstanding and no shares of preferred stock outstanding. Pursuant to the Certificate of Incorporation, the Board has the authority, without stockholder approval except as required by the listing standards of Nasdaq, to issue additional shares of Class A Common Stock. Until the final conversion of all outstanding shares of Class B Common Stock pursuant to the terms of the Certificate of Incorporation, or the Final Conversion Date, any issuance of additional shares of Class B Common Stock requires the approval of the holders of at least
two-thirds
of the outstanding shares of Class B Common Stock voting as a separate class. Common Stock
We have two series of authorized common stock, Class A Common Stock and Class B Common Stock. The rights of the holders of Class A Common Stock and Class B Common Stock are generally identical, except with respect to voting and conversion.
Dividend Rights
Subject to preferences that may apply to any shares of preferred stock outstanding at the time, the holders of common stock are entitled to receive dividends out of funds legally available if the Board, in its discretion, determines to issue dividends and then only at the times and in the amounts that the Board may determine. See the section titled “” for additional information.
Market Price of the Registrant’s common Equity and Related Stockholder Matters—Dividend Policy
Voting Rights
Holders of Class A Common Stock are entitled to one vote for each share held as of the applicable record date on all matters submitted to a vote of stockholders and holders of Class B Common Stock are entitled to 10 votes for each share held as of the applicable record date on all matters submitted to a vote of stockholders. The holders of Class A Common Stock and Class B Common Stock will generally vote together as a single class, unless otherwise required by law. Under the Certificate of Incorporation, approval of the holders of a majority of the outstanding shares of Class B Common Stock voting as a separate class is required to increase or decrease the number of authorized shares of Class B Common Stock. In addition, Delaware law could require either holders of Class A Common Stock or Class B Common Stock to vote separately as a single class if we were to seek to
-125-
amend our Certificate of Incorporation in a manner that alters or changes the powers, preferences or special rights of the Class A Common Stock or the Class B Common Stock in a manner that affected its holders adversely but does not so affect the shares of the other series of common stock, then that series would be required to vote separately to approve the proposed amendment.
Until the Final Conversion Date, approval of at least
two-thirds
of the outstanding shares of Class B Common Stock voting as a separate class is required to: | • | amend or modify any provision of the Certificate of Incorporation inconsistent with, or otherwise alter, any provision of the Certificate of Incorporation to modify the voting, conversion or other rights, powers, preferences, privileges or restrictions of the Class B Common Stock; |
| • | reclassify any outstanding shares of Class A Common Stock into shares having rights as to dividends or liquidation that are senior to the Class B Common Stock or the right to have more than one vote for each share thereof; |
| • | issue any shares of Class B Common Stock, including by dividend, distribution or otherwise; or |
| • | authorize, or issue any shares of, any class or series of our capital stock having the right to more than one vote for each share thereof. |
Our Certificate of Incorporation provides for a classified board of directors consisting of three classes of approximately equal size, each serving staggered three-year terms. Only the directors in one class will be subject to election by a plurality of the votes cast at each annual meeting of stockholders, with the directors in the other classes continuing for the remainder of their respective three-year terms. Stockholders do not have the ability to cumulate votes for the election of directors.
No Preemptive or Similar Rights
Our common stock is not entitled to preemptive rights, is not subject to conversion, redemption or sinking fund provisions.
Right to Receive Liquidation Distributions
If we become subject to a liquidation, dissolution
or winding-up
in connection with which the Board has determined to effect a distribution of assets to any holders of common stock, the assets legally available for distribution to our stockholders would be distributable ratably among the holders of common stock and any participating Aurora preferred stock outstanding at that time, subject to prior satisfaction of all outstanding debt and liabilities and the preferential rights of and the payment of liquidation preferences, if any, on any outstanding shares of preferred stock. Conversion of Class B Common Stock
Each share of Class B Common Stock is convertible at any time at the option of the holder into one share of Class A Common Stock. Shares of Class B Common Stock will automatically convert into shares of Class A Common Stock upon sale or transfer except for certain transfers described in the Certificate of Incorporation, including estate planning or charitable transfers where sole dispositive power and exclusive voting control with respect to the shares of Class B Common Stock are retained by the transferring holder or such transferring holder’s spouse. In addition, each outstanding share of Class B Common Stock held by a stockholder who is a natural person, or held by the permitted entities and permitted transferees of such natural person (as described in the Certificate of Incorporation), will convert automatically into one share of Class A Common Stock upon the death of such natural person. In the event of the death or permanent and total disability of an Aurora Founder, shares of Class B Common Stock held by such Aurora Founder, his permitted entities or permitted transferees will convert to Class A Common Stock, provided that the conversion will be deferred for nine months, or up to
-126-
18 months if approved by a majority of our independent directors, following his death or permanent and total disability and provided further, that to the extent any other Aurora Founder has or shares voting control over such shares, the shares of Class B Common Stock will be treated as held of record by the Aurora Founder that has or shares voting control. Transfers between the Aurora Founders are permitted transfers and will not result in conversion of the shares of Class B Common Stock that are transferred and such shares of Class B Common Stock will be treated as held of record by the transferee Aurora Founder. With respect to any shares of Class B Common Stock over which the spouse of an Aurora Founder has voting control, such shares of Class B Common Stock will convert to shares of Class A Common Stock upon divorce if the spouse retains voting control.
Each share of Class B Common Stock will convert automatically into one share of Class A Common Stock upon (i) the date specified by affirmative written election of the holders of
two-thirds
of the then-outstanding shares of Class B Common Stock, (ii) the date fixed by the Board that is no less than 61 days and no more than 180 days following the date on which the shares of Class B Common Stock held by the Aurora Founders and their permitted entities and permitted transferees represent less than 20% of the Class B Common Stock held by the Aurora Founders and their permitted entities as of immediately following the consummation of the Business Combination or (iii) nine months after the death or total disability of the last to die or become disabled of the Aurora Founders, or such later date not to exceed a total period of 18 months after such death or disability as may be approved by a majority of our independent directors. Preferred stock
The Board has the authority, subject to limitations prescribed by Delaware law and the terms of the Certificate of Incorporation, to issue Preferred stock in one or more series, to establish from time to time the number of shares to be included in each series and to fix the designation, powers, preferences and rights of the shares of each series and any of its qualifications, limitations or restrictions, in each case without further vote or action by our stockholders. The Board can also increase or decrease the number of shares of any series of Preferred stock, but not below the number of shares of that series then outstanding, without any further vote or action by our stockholders. The Board may authorize the issuance of Preferred stock with voting or conversion rights that could adversely affect the voting power or other rights of the holders of common stock. The issuance of Preferred stock, while providing flexibility in connection with possible acquisitions and other corporate purposes, could, among other things, have the effect of delaying, deferring or preventing a change in control of our company and might adversely affect the market price of common stock and the voting and other rights of the holders of common stock. We have no current plan to issue any shares of Preferred stock.
Registration Rights
Under the Registration Rights Agreement, the holders of 690,536,845 shares of Aurora common stock or their permitted transferees have the right to require us to register the offer and sale of their shares, or to include their shares in any registration statement that we file, in each case as described below.
Shelf Registration Rights
We are required to file a registration statement for an offering to be made on a delayed or continuous basis no later than 30 days following the Closing of the Merger on a
Form S-3, or,
if we are ineligible to use a Form S-3,
on a Form S-1.
The holders of at least $50.0 million of shares having registration rights then outstanding can request that we effect an underwritten public offering pursuant to such resale shelf registration statement. We are not obligated to effect more than eight (8) such registrations within any 12-month period.
These shelf registration rights are subject to specified conditions and limitations, including the right of the managing underwriter or underwriters to limit the number of shares included in any such registration under certain circumstances. -127-
Piggyback Registration Rights
If we propose to register the offer and sale of our common stock under the Securities Act, all holders of these shares then outstanding can request that we include their shares in such registration, subject to certain marketing and other limitations, including the right of the underwriters to limit the number of shares included in any such registration statement under certain circumstances. As a result, whenever we propose to file a registration statement under the Securities Act, other than with respect to a registration (i) relating to any employee stock option or other benefit plan, (ii) on Form
S-4
(or similar form that relates to a transaction subject to Rule 145 under the Securities Act or any successor rule thereto), (iii) relating to an offering of debt that is convertible into equity securities of Aurora, (iv) for a dividend reinvestment plan, (v) a “block trade,” or an underwritten registered offering not involving a roadshow or (vi) an “at the market” or similar registered offering through a broker, sales agent or distribution agent, whether as agent or principal, the holders of these shares are entitled to notice of the registration and have the right, subject to certain limitations, to include their shares in the registration. Registration Rights for PIPE Shares
In connection with the Business Combination, RTPY entered into the Subscription Agreements, pursuant to which RTPY has agreed to issue and sell to the PIPE Investors, and the PIPE Investors have agreed to buy from RTPY, 100,000,000 shares of Class A Common Stock (the “PIPE Shares”) at a purchase price of $10.00 per share for an aggregate commitment of $1.0 billion. The PIPE Investment was consummated substantially concurrently with the closing of the Merger.
Pursuant to the Subscription Agreements, RTPY agreed that, within thirty (30) calendar days after the consummation of the Business Combination, RTPY will file with the SEC (at RTPY’s sole cost and expense) a registration statement registering the resale of the PIPE Shares, and that RTPY shall use its commercially reasonable efforts to have such resale registration statement declared effective as soon as practicable after the filing thereof but no later than the earlier of (i) sixty (60) calendar days (or ninety (90) calendar days if the SEC notifies RTPY that it will review such registration statement) following the filing thereof and (ii) ten (10) business days after RTPY is notified (orally or in writing, whichever is earlier) by the SEC that the registration statement will not be reviewed or will not be subject to further review.
Warrants
Public Warrants
Each Warrant entitles the registered holder to purchase one share of Class A Common Stock at a price of $11.50 per share, subject to adjustment as discussed below, at any time commencing 30 days after the completion of our Business Combination. The Warrants will expire five years after the completion of the Business Combination, at 5:00 p.m., New York City time, or earlier upon redemption or liquidation.
We are not obligated to deliver any shares of Class A Common Stock pursuant to the exercise of a Warrant and will have no obligation to settle such Warrant exercise unless a registration statement under the Securities Act covering the issuance of the Class A Common Stock issuable upon exercise of the Warrants is then effective and a current prospectus relating thereto is current, subject to our satisfying our obligations described below with respect to registration, or a valid exemption from registration is available, including as a result of a notice of redemption described below under “
”. No Warrant will be exercisable for cash or on a cashless basis, and we will not be obligated to issue any shares to holders seeking to exercise their Warrants, unless the issuance of the shares upon such exercise is registered or qualified under the securities laws of the state of the exercising holder, or an exemption is available. In the event that the conditions in the two immediately preceding sentences are not satisfied with respect to a Warrant, the holder of such Warrant will not be entitled to exercise such Warrant and such Warrant may have no value and expire worthless.
Redemption of Warrants when the price per share of Class
A Common Stock equals or exceeds $10.00
We have agreed that as soon as practicable, but in no event later than 15 business days, after the closing of the Business Combination, we will use our commercially reasonable efforts to file with the SEC a registration
-128-
statement covering the issuance, under the Securities Act, of the shares of Class A Common Stock issuable upon exercise of the Warrants, and we will use our commercially reasonable efforts to cause the same to become effective within 60 business days after the closing of the Business Combination and to maintain the effectiveness of such registration statement, and a current prospectus relating thereto, until the expiration of the Warrants in accordance with the provisions of the Warrant Agreement. Notwithstanding the above, if our shares of Class A Common Stock are, at the time of any exercise of a Warrant, not listed on a national securities exchange such that they satisfy the definition of a “covered security” under Section 18(b)(1) of the Securities Act, we may, at our option, require holders of Public Warrants who exercise their Public Warrants to do so on a “cashless basis” in accordance with Section 3(a)(9) of the Securities Act and, in the event we so elect, we will not be required to file or maintain in effect a registration statement, but will use our commercially reasonable efforts to register or qualify the shares under applicable blue sky laws to the extent an exemption is not available. In such event, each holder would pay the exercise price by surrendering the Warrants for that number of shares of Class A Common Stock equal to the lesser of (A) the quotient obtained by dividing (x) the product of the number of shares of Class A Common Stock underlying the Warrants, multiplied by the excess of the “fair market value” (defined below) less the exercise price of the Warrants by (y) the fair market value and (B) 0.361. The “fair market value” shall mean the volume weighted average price of the shares of Class A Common Stock for the 10 trading days ending on the trading day prior to the date on which the notice of exercise is received by the warrant agent.
Redemption of Warrants when the price per share of Class A Common Stock equals or exceeds $18.00
Once the Warrants become exercisable, we may redeem the outstanding Warrants (except as described herein with respect to the Private Placement Warrants):
| • | in whole and not in part; |
| • | at a price of $0.01 per Warrant; |
| • | upon not less than 30 days’ written notice of redemption to each Warrant holder; and |
| • | if and only if, the last reported sale price of the shares of Class A Common Stock for any 20 trading days within a 30-trading day period ending on the third trading day prior to the date on which we send the notice of redemption to the Warrant holders (which we refer to as the “Reference Value”) equals or exceeds $18.00 per share (as adjusted for share splits, share dividends, rights issuances, subdivisions, reorganizations, recapitalizations and the like) |
We will not redeem the Warrants as described above unless a registration statement under the Securities Act covering the issuance of the shares of Class A Common Stock issuable upon exercise of the Warrants is then effective and a current prospectus relating to those shares of Class A Common Stock is available throughout the
30-day
redemption period. If and when the Warrants become redeemable by us, we may exercise our redemption right even if we are unable to register or qualify the underlying securities for sale under all applicable state securities laws. We have established the last of the redemption criterion discussed above to prevent a redemption call unless there is at the time of the call a significant premium to the Warrant exercise price. If the foregoing conditions are satisfied and we issue a notice of redemption of the Warrants, each Warrant holder will be entitled to exercise his, her or its warrant prior to the scheduled redemption date. However, the price of the shares of Class A Common Stock may fall below the $18.00 redemption trigger price (as adjusted for share splits, share dividends, rights issuances, subdivisions, reorganizations, recapitalizations and the like) as well as the $11.50 (for whole shares) Warrant exercise price after the redemption notice is issued.
Redemption of Warrants when the price per share of Class A Common Stock equals or exceeds $10.00
Once the Warrants become exercisable, we may redeem the outstanding Warrants:
| • | in whole and not in part; |
-129-
| • | at $0.10 per Warrant upon a minimum of 30 days’ prior written notice of redemption provided that holders will be able to exercise their Warrants on a cashless basis prior to redemption and receive that number of shares determined by reference to the table below, based on the redemption date and the “fair market value” (as defined below) of our shares of Class A Common Stock except as otherwise described below; |
| • | if, and only if, the Reference Value (as defined above under “ Redemption of Warrants when the price per share of Class A Common Stock equals or exceeds $18.00 |
| • | if the Reference Value is less than $18.00 per share (as adjusted for share splits, share dividends, rights issuances, subdivisions, reorganizations, recapitalizations and the like), the Private Placement Warrants must also be concurrently called for redemption on the same terms as the outstanding Public Warrants, as described above. |
The numbers in the table below represent the number of shares of Class A Common Stock that a Warrant holder will receive upon exercise in connection with a redemption by us pursuant to this redemption feature, based on the “fair market value” of our shares of Class A Common Stock on the corresponding redemption date (assuming holders elect to exercise their Warrants and such Warrants are not redeemed for $0.10 per Warrant), determined based on volume weighted average price of our shares of Class A Common Stock during the 10 trading days immediately following the date on which the notice of redemption is sent to the holders of Warrants, and the number of months that the corresponding redemption date precedes the expiration date of the Warrants, each as set forth in the table below. We will provide our Warrant holders with the final fair market value no later than one business day after the
10-trading
day period described above ends. -130-
The share prices set forth in the column headings of the table below will be adjusted as of any date on which the number of shares issuable upon exercise of a Warrant is adjusted as set forth in the first three paragraphs under the heading “—” below. The adjusted share prices in the column headings will equal the share prices immediately prior to such adjustment, multiplied by a fraction, the numerator of which is the number of shares deliverable upon exercise of a Warrant immediately prior to such adjustment and the denominator of which is the number of shares deliverable upon exercise of a Warrant as so adjusted. The number of shares in the table below shall be adjusted in the same manner and at the same time as the number of shares issuable upon exercise of a Warrant.
Anti-dilution Adjustments
Redemption Date |
Fair Market Value of Class A Common Stock |
|||||||||||||||||||||||||||||||||||
(period to expiration of warrants) |
³
10.00 |
11.00 |
12.00 |
13.00 |
14.00 |
15.00 |
16.00 |
17.00 |
³
18.00 |
|||||||||||||||||||||||||||
| 60 months |
0.261 | 0.281 | 0.297 | 0.311 | 0.324 | 0.337 | 0.348 | 0.358 | 0.361 | |||||||||||||||||||||||||||
| 57 months |
0.257 | 0.277 | 0.294 | 0.310 | 0.324 | 0.337 | 0.348 | 0.358 | 0.361 | |||||||||||||||||||||||||||
| 54 months |
0.252 | 0.272 | 0.291 | 0.307 | 0.322 | 0.335 | 0.347 | 0.357 | 0.361 | |||||||||||||||||||||||||||
| 51 months |
0.246 | 0.268 | 0.287 | 0.304 | 0.320 | 0.333 | 0.346 | 0.357 | 0.361 | |||||||||||||||||||||||||||
| 48 months |
0.241 | 0.263 | 0.283 | 0.301 | 0.317 | 0.332 | 0.344 | 0.356 | 0.361 | |||||||||||||||||||||||||||
| 45 months |
0.235 | 0.258 | 0.279 | 0.298 | 0.315 | 0.330 | 0.343 | 0.356 | 0.361 | |||||||||||||||||||||||||||
| 42 months |
0.228 | 0.252 | 0.274 | 0.294 | 0.312 | 0.328 | 0.342 | 0.355 | 0.361 | |||||||||||||||||||||||||||
| 39 months |
0.221 | 0.246 | 0.269 | 0.290 | 0.309 | 0.325 | 0.340 | 0.354 | 0.361 | |||||||||||||||||||||||||||
| 36 months |
0.213 | 0.239 | 0.263 | 0.285 | 0.305 | 0.323 | 0.339 | 0.353 | 0.361 | |||||||||||||||||||||||||||
| 33 months |
0.205 | 0.232 | 0.257 | 0.280 | 0.301 | 0.320 | 0.337 | 0.352 | 0.361 | |||||||||||||||||||||||||||
| 30 months |
0.196 | 0.224 | 0.250 | 0.274 | 0.297 | 0.316 | 0.335 | 0.351 | 0.361 | |||||||||||||||||||||||||||
| 27 months |
0.185 | 0.214 | 0.242 | 0.268 | 0.291 | 0.313 | 0.332 | 0.350 | 0.361 | |||||||||||||||||||||||||||
| 24 months |
0.173 | 0.204 | 0.233 | 0.260 | 0.285 | 0.308 | 0.329 | 0.348 | 0.361 | |||||||||||||||||||||||||||
| 21 months |
0.161 | 0.193 | 0.223 | 0.252 | 0.279 | 0.304 | 0.326 | 0.347 | 0.361 | |||||||||||||||||||||||||||
| 18 months |
0.146 | 0.179 | 0.211 | 0.242 | 0.271 | 0.298 | 0.322 | 0.345 | 0.361 | |||||||||||||||||||||||||||
| 15 months |
0.130 | 0.164 | 0.197 | 0.230 | 0.262 | 0.291 | 0.317 | 0.342 | 0.361 | |||||||||||||||||||||||||||
| 12 months |
0.111 | 0.146 | 0.181 | 0.216 | 0.250 | 0.282 | 0.312 | 0.339 | 0.361 | |||||||||||||||||||||||||||
| 9 months |
0.090 | 0.125 | 0.162 | 0.199 | 0.237 | 0.272 | 0.305 | 0.336 | 0.361 | |||||||||||||||||||||||||||
| 6 months |
0.065 | 0.099 | 0.137 | 0.178 | 0.219 | 0.259 | 0.296 | 0.331 | 0.361 | |||||||||||||||||||||||||||
| 3 months |
0.034 | 0.065 | 0.104 | 0.150 | 0.197 | 0.243 | 0.286 | 0.326 | 0.361 | |||||||||||||||||||||||||||
| 0 months |
— | — | 0.042 | 0.115 | 0.179 | 0.233 | 0.281 | 0.323 | 0.361 | |||||||||||||||||||||||||||
The exact fair market value and redemption date may not be set forth in the table above, in which case, if the fair market value is between two values in the table or the redemption date is between two redemption dates in the table, the number of shares of Class A Common Stock to be issued for each Warrant exercised will be determined by a straight-line interpolation between the number of shares set forth for the higher and lower fair market values and the earlier and later redemption dates, as applicable, based on a 365 or
366-day
year, as applicable. For example, if the volume weighted average price of our shares of Class A Common Stock during the 10 trading days immediately following the date on which the notice of redemption is sent to the holders of the Warrants is $11.00 per share, and at such time there are 57 months until the expiration of the Warrants, holders may choose to, in connection with this redemption feature, exercise their Warrants for 0.277 shares of Class A Common Stock for each whole Warrant. For an example where the exact fair market value and redemption date are not as set forth in the table above, if the volume weighted average price of our shares of Class A Common Stock during the 10 trading days immediately following the date on which the notice of redemption is sent to the holders of the Warrants is $13.50 per share, and at such time there are 38 months until the expiration of the Warrants, holders may choose to, in connection with this redemption feature, exercise their Warrants for 0.298 shares of Class A Common Stock for each whole warrant. In no event will the Warrants be exercisable in connection with this redemption feature for more than 0.361 shares of Class A Common Stock per Warrant (subject to adjustment). Finally, as reflected in the table above, if the Warrants are out of the money and about to expire, they cannot be exercised on a cashless basis in connection with a redemption by us pursuant to this redemption feature, since they will not be exercisable for any shares of Class A Common Stock. -131-
This redemption feature differs from the typical Warrant redemption features used in many other blank check offerings, which typically only provide for a redemption of Warrants for cash (other than the Private Placement Warrants) when the trading price for the shares of Class A Common Stock exceeds $18.00 per share for a specified period of time. This redemption feature is structured to allow for all of the outstanding Warrants to be redeemed when the shares of Class A Common Stock are trading at or above $10.00 per share, which may be at a time when the trading price of our shares of Class A Common Stock is below the exercise price of the Warrants. We have established this redemption feature to provide us with the flexibility to redeem the Warrants without the Warrants having to reach the $18.00 per share threshold set forth above under “——
.” Holders choosing to exercise their Warrants in connection with a redemption pursuant to this feature will, in effect, receive a number of shares for their Warrants based on an option pricing model with a fixed volatility input as of the date of the RTPY IPO. This redemption right provides us with an additional mechanism by which to redeem all of the outstanding Warrants, and therefore have certainty as to our capital structure as the Warrants would no longer be outstanding and would have been exercised or redeemed. We will be required to pay the applicable redemption price to Warrant holders if we choose to exercise this redemption right and it will allow us to quickly proceed with a redemption of the Warrants if we determine it is in our best interest to do so. As such, we would redeem the Warrants in this manner when we believe it is in our best interest to update our capital structure to remove the Warrants and pay the redemption price to the Warrant holders.
Description of Capital Stock
Warrants—Public Warrants
Redemption of Warrants when the price per share of Class
A Common Stock equals or exceeds $18.00
As stated above, we can redeem the Warrants when the shares of Class A Common Stock are trading at a price starting at $10.00, which is below the exercise price of $11.50, because it will provide certainty with respect to our capital structure and cash position while providing Warrant holders with the opportunity to exercise their Warrants on a cashless basis for the applicable number of shares. If we choose to redeem the Warrants when the shares of Class A Common Stock are trading at a price below the exercise price of the Warrants, this could result in the Warrant holders receiving fewer shares of Class A Common Stock than they would have received if they had chosen to wait to exercise their Warrants for shares of Class A Common Stock if and when such shares of Class A Common Stock were trading at a price higher than the exercise price of $11.50.
No fractional shares of Class A Common Stock will be issued upon exercise. If, upon exercise, a holder would be entitled to receive a fractional interest in a share, we will round down to the nearest whole number of the number of shares of Class A Common Stock to be issued to the holder. If, at the time of redemption, the Warrants are exercisable for a security other than the shares of Class A Common Stock pursuant to the Warrant Agreement, the Warrants may be exercised for such security. At such time as the Warrants become exercisable for a security other than the shares of Class A Common Stock, the Company will use its commercially reasonable efforts to register under the Securities Act the security issuable upon the exercise of the Warrants.
Redemption procedures
A holder of a Warrant may notify us in writing in the event it elects to be subject to a requirement that such holder will not have the right to exercise such Warrant, to the extent that after giving effect to such exercise, such person (together with such person’s affiliates), to the warrant agent’s actual knowledge, would beneficially own in excess of 9.8% (or such other amount as a holder may specify) of the shares of Class A Common Stock issued and outstanding immediately after giving effect to such exercise.
Anti-dilution Adjustments
If the number of issued and outstanding shares of Class A Common Stock is increased by a capitalization or share dividend payable in shares of Class A Common Stock, or by a
split-up
of shares of Class A Common Stock or other similar event, then, on the effective date of such capitalization or share dividend, split-up
or similar event, the number of shares of Class A Common Stock issuable on exercise of each Warrant will be increased in proportion to such increase in the issued and outstanding shares of Class A Common Stock. A rights offering to -132-
holders of shares of Class A Common Stock entitling holders to purchase shares of Class A Common Stock at a price less than the “historical fair market value” (as defined below) will be deemed a share dividend of a number of shares of Class A Common Stock equal to the product of (1) the number of shares of Class A Common Stock actually sold in such rights offering (or issuable under any other equity securities sold in such rights offering that are convertible into or exercisable for shares of Class A Common Stock) and (2) one minus the quotient of (x) the price per share of Class A Common Stock paid in such rights offering and (y) the historical fair market value. For these purposes, (1) if the rights offering is for securities convertible into or exercisable for shares of Class A Common Stock, in determining the price payable for shares of Class A Common Stock, there will be taken into account any consideration received for such rights, as well as any additional amount payable upon exercise or conversion and (2) “historical fair market value” means the volume weighted average price of shares of Class A Common Stock during the 10 trading day period ending on the trading day prior to the first date on which the shares of Class A Common Stock trade on the applicable exchange or in the applicable market, regular way, without the right to receive such rights.
In addition, if we, at any time while the Warrants are outstanding and unexpired, pay a dividend or make a distribution in cash, securities or other assets to the holders of shares of Class A Common Stock on account of such shares of Class A Common Stock (or other securities into which the Warrants are convertible), other than (a) as described above, (b) any cash dividends or cash distributions which, when combined on a per share basis with all other cash dividends and cash distributions paid on the shares of Class A Common Stock during the
365-day
period ending on the date of declaration of such dividend or distribution does not exceed $0.50 (as adjusted for share splits, share dividends, rights issuances, subdivisions, reorganizations, recapitalizations and the like) but only with respect to the amount of the aggregate cash dividends or cash distributions equal to or less than $0.50 per share, then the Warrant exercise price will be decreased, effective immediately after the effective date of such event, by the amount of cash and/or the fair market value of any securities or other assets paid on each share of Class A Common Stock in respect of such event. If the number of issued and outstanding shares of Class A Common Stock is decreased by a consolidation, combination, reverse share split or reclassification of shares of Class A Common Stock or other similar event, then, on the effective date of such consolidation, combination, reverse share split, reclassification or similar event, the number of shares of Class A Common Stock issuable on exercise of each Warrant will be decreased in proportion to such decrease in issued and outstanding shares of Class A Common Stock.
Whenever the number of shares of Class A Common Stock purchasable upon the exercise of the Warrants is adjusted, as described above, the Warrant exercise price will be adjusted by multiplying the Warrant exercise price immediately prior to such adjustment by a fraction (x) the numerator of which will be the number of shares of Class A Common Stock purchasable upon the exercise of the Warrants immediately prior to such adjustment and (y) the denominator of which will be the number of shares of Class A Common Stock so purchasable immediately thereafter.
In case of any reclassification or reorganization of the issued and outstanding shares of Class A Common Stock (other than those described above or that solely affects the par value of such shares of Class A Common Stock), or in the case of any merger or consolidation of us with or into another corporation (other than a consolidation or merger in which we are the continuing corporation and that does not result in any reclassification or reorganization of our issued and outstanding shares of Class A Common Stock), or in the case of any sale or conveyance to another corporation or entity of the assets or other property of us as an entirety or substantially as an entirety in connection with which we are dissolved, the holders of the Warrants will thereafter have the right to purchase and receive, upon the basis and upon the terms and conditions specified in the Warrants and in lieu of our shares of Class A Common Stock immediately theretofore purchasable and receivable upon the exercise of the rights represented thereby, the kind and amount of shares of stock or other securities or property (including cash) receivable upon such reclassification, reorganization, merger or consolidation, or upon a dissolution following any such sale or transfer, that the holder of the Warrants would have received if such holder had exercised their Warrants immediately prior to such event. However, if such holders were entitled to
-133-
exercise a right of election as to the kind or amount of securities, cash or other assets receivable upon such consolidation or merger, then the kind and amount of securities, cash or other assets for which each Warrant will become exercisable will be deemed to be the weighted average of the kind and amount received per share by such holders in such consolidation or merger that affirmatively make such election, and if a tender, exchange or redemption offer has been made to and accepted by such holders (other than a tender, exchange or redemption offer made by the Company in connection with redemption rights held by stockholders of the Company as provided for in our Certificate of Incorporation and Bylaws) under circumstances in which, upon completion of such tender or exchange offer, the maker thereof, together with members of any group (within the meaning of Rule market, or is to be so listed for trading or quoted immediately following such event, and if the registered holder of the Warrant properly exercises the Warrant within 30 days following public disclosure of such transaction, the Warrant exercise price will be reduced as specified in the Warrant Agreement based on the per share consideration minus Black-Scholes Warrant Value (as defined in the Warrant Agreement) of the warrant.
13d-5(b)(1)
under the Exchange Act) of which such maker is a part, and together with any affiliate or associate of such maker (within the meaning of Rule 12b-2
under the Exchange Act) and any members of any such group of which any such affiliate or associate is a part, own beneficially (within the meaning of Rule 13d-3
under the Exchange Act) more than 50% of the issued and outstanding shares of Class A Common Stock, the holder of a Warrant will be entitled to receive the highest amount of cash, securities or other property to which such holder would actually have been entitled as a shareholder if such Warrant holder had exercised the Warrant prior to the expiration of such tender or exchange offer, accepted such offer and all of the shares of Class A Common Stock held by such holder had been purchased pursuant to such tender or exchange offer, subject to adjustment (from and after the consummation of such tender or exchange offer) as nearly equivalent as possible to the adjustments provided for in the Warrant Agreement. Additionally, if less than 70% of the consideration receivable by the holders of shares of Class A Common Stock in such a transaction is payable in the form of Class A Common Stock in the successor entity that is listed for trading on a national securities exchange or is quoted in an established over-the-counter
The Warrants have been issued in registered form under the Warrant Agreement. The Warrant Agreement provides that the terms of the Warrants may be amended without the consent of any holder to cure any ambiguity or correct any defective provision, but requires the approval by the holders of at least 50% of the then issued and outstanding Public Warrants to make any change that adversely affects the interests of the registered holders of Public Warrants.
The Warrant holders do not have the rights or privileges of holders of ordinary shares and any voting rights until they exercise their Warrants and receive shares of Class A Common Stock. After the issuance of shares of Class A Common Stock upon exercise of the Warrants, each holder will be entitled to one vote for each share held of record on all matters to be voted on by shareholders.
Private Placement Warrants
The Private Placement Warrants (including the shares of Class A Common Stock issuable upon exercise of the Private Placement Warrants) will not be transferable, assignable or salable until 30 days after the Closing (except, among other limited exceptions, to our directors and officers and other persons or entities affiliated with our sponsor) and they will not be redeemable by us (except as described under “——
”) so long as they are held by the Sponsor or its permitted transferees. The Sponsor, or its permitted transferees, has the option to exercise the Private Placement Warrants on a cashless basis and have certain registration rights described herein. Otherwise, the Private Placement Warrants have terms and provisions that are identical to those of the Public Warrants. If the Private Placement Warrants are held by holders other than the Sponsor or its permitted transferees, the Private Placement Warrants will be redeemable by us in all redemption scenarios and exercisable by the holders on the same basis as the Public Warrants.
Description of Capital Stock
Warrants—Public Warrants
Redemption of Warrants when the price per share of Class
A Common Stock equals or exceeds $10.00
Except as described under “——
,” if holders of the Private
Description of Capital Stock
Warrants—Public Warrants
Redemption of Warrants when the price per share of Class
A Common Stock equals or exceeds $10.00
-134-
Placement Warrants elect to exercise them on a cashless basis, they would pay the exercise price by surrendering his, her or its Warrants for that number of shares of Class A Common Stock equal to the quotient obtained by dividing (x) the product of the number of shares of Class A Common Stock underlying the Warrants, multiplied by the excess of the “historical fair market value” (as defined below) less the exercise price of the Warrants by (y) the historical fair market value. For these purposes, the “historical fair market value” shall mean the average last reported sale price of the shares of Class A Common Stock for the 10 trading days ending on the third trading day prior to the date on which the notice of Warrant exercise is sent to the warrant agent.
Form S-8
Registration Statement We intend to file one or more registration statements on
Form S-8
under the Securities Act to register the shares of Class A Common Stock issued or issuable under our 2021 Plan. Any such Form S-8
registration statement will become effective automatically upon filing. We expect that the initial registration statement on Form S-8
will cover shares of Class A Common Stock underlying the 2021 Plan. Once these shares are registered, they can be sold in the public market upon issuance, subject to Rule 144 limitations applicable to affiliates and vesting restrictions. We may file in the future one or more registration statements on Form S-8
under the Securities Act to register the shares of Class A Common Stock issued or issuable under our ESPP. Anti-Takeover Provisions
Certain provisions of Delaware law, and of the Certificate of Incorporation and the Bylaws, which are summarized below, may have the effect of delaying, deferring or discouraging another person from acquiring control of us. They are also designed, in part, to encourage persons seeking to acquire control of us to negotiate first with the Board. We believe that the benefits of increased protection of our potential ability to negotiate with an unfriendly or unsolicited acquirer outweigh the disadvantages of discouraging a proposal to acquire us because negotiation of these proposals could result in an improvement of their terms.
Delaware Law
We are governed by the provisions of Section 203 of the Delaware General Corporation Law. In general, Section 203 prohibits a public Delaware corporation from engaging in a “business combination” with an “interested stockholder” for a period of three years after the date of the transaction in which the person became an interested stockholder, unless:
| • | the business combination or transaction which resulted in the stockholder becoming an interested stockholder was approved by the Board prior to the time that the stockholder became an interested stockholder; |
| • | upon consummation of the transaction which resulted in the stockholder becoming an interested stockholder, the interested stockholder owned at least 85% of the voting stock of the corporation outstanding at the time the transaction commenced, excluding shares owned by directors who are also officers of the corporation and shares owned by employee stock plans in which employee participants do not have the right to determine confidentially whether shares held subject to the plan will be tendered in a tender or exchange offer; or |
| • | at or subsequent to the time the stockholder became an interested stockholder, the business combination was approved by the Board and authorized at an annual or special meeting of the stockholders, and not by written consent, by the affirmative vote of at least two-thirds of the outstanding voting stock which is not owned by the interested stockholder. |
In general, Section 203 defines a “business combination” to include mergers, asset sales and other transactions resulting in financial benefit to a stockholder and an “interested stockholder” as a person who, together with affiliates and associates, owns, or is an affiliate or associate of the corporation and within three years did own, 15% or more of the corporation’s outstanding voting stock. These provisions may have the effect of delaying, deferring or preventing changes in control of our company.
-135-
Certificate of Incorporation and Bylaw Provisions
The Certificate of Incorporation and Bylaws include a number of provisions that could deter hostile takeovers or delay or prevent changes in control of the Board or management team, including the following:
Dual Class Stock
As described above in “,” the Certificate of Incorporation provides for a dual class common stock structure, which provides the Aurora Founders and certain other stockholders who hold Class B Common Stock, individually or together, with significant influence over matters requiring stockholder approval, including the election of directors and significant corporate transactions, such as a merger or other sale of our company or its assets.
Description of Capital Stock
Classified Board
The Certificate of Incorporation provides that the Board is classified into three classes of directors, each of which will hold office for a three-year term after the initial classification. In addition, directors may only be removed from the Board for cause. The existence of a classified board could delay a potential acquirer from obtaining majority control of our board of directors, and the prospect of that delay might deter a potential acquirer. See the section titled “”
Management—Classified Board of Directors].
Board of Directors Vacancies
The Certificate of Incorporation and Bylaws authorize only the board of directors to fill vacant directorships, including newly created seats. In addition, the number of directors constituting the Board is permitted to be set only by a resolution adopted by a majority vote of our entire board of directors. These provisions prevent a stockholder from increasing the size of the Board and then gaining control of our board of directors by filling the resulting vacancies with its own nominees. This makes it more difficult to change the composition of the Board and promotes continuity of management.
Stockholder Action; Special Meeting of Stockholders
The Certificate of Incorporation provides that our stockholders may not take action by written consent but may only take action at annual or special meetings of our stockholders. As a result, a holder controlling a majority of our capital stock would not be able to amend our Bylaws or remove directors without holding a meeting of our stockholders called in accordance with the Bylaws. The Bylaws further provide that special meetings of our stockholders may be called only by a majority of the Board, the chairperson of the Board, our Chief Executive Officer or our President, thus prohibiting a stockholder from calling a special meeting. These provisions might delay the ability of our stockholders to force consideration of a proposal or for stockholders controlling a majority of our capital stock to take any action, including the removal of directors.
Advance Notice Requirements for Stockholder Proposals and Director Nominations
Our Bylaws provide advance notice procedures for stockholders seeking to bring business before our annual meeting of stockholders or to nominate candidates for election as directors at our annual meeting of stockholders or a special meeting of stockholders at which the election of directors is included as business to be brought before the special meeting. Our Bylaws also specify certain requirements regarding the form and content of a stockholder’s notice. These provisions might preclude our stockholders from bringing matters before our annual meeting of stockholders or from making nominations for directors at our annual meeting of stockholders or a special meeting of stockholders if the proper procedures are not followed. We expect that these provisions may also discourage or deter a potential acquirer from conducting a solicitation of proxies to elect the acquirer’s own slate of directors or otherwise attempting to obtain control of our company.
-136-
Lock-up
Our Bylaws contain a
lock-up
provision which provides that, without the prior unanimous consent of the Board and subject to certain customary exceptions, each holder of common stock issued (i) as the Aggregate Merger Consideration (as defined in the Merger Agreement) pursuant to the Merger or (ii) to directors, officers and employees upon the settlement or exercise of stock options, restricted stock units, or other equity awards outstanding as of immediately following the closing of the Merger in respect of Legacy Aurora Awards, will not, for a period ending 180 calendar days following the effective time of the Merger, directly or indirectly, sell, transfer, assign, pledge, encumber, hypothecate or similarly dispose of such shares of common stock. No Cumulative Voting
The Delaware General Corporation Law provides that stockholders are not entitled to cumulate votes in the election of directors unless a corporation’s certificate of incorporation provides otherwise. The Certificate of Incorporation does not provide for cumulative voting.
Amendment of Certificate of Incorporation and Bylaws Provisions
Amendments to certain provisions of our Certificate of Incorporation will require the approval of at least
two-thirds
of the outstanding voting power of common stock. The Bylaws provide that approval of stockholders holding at least two-thirds
of our outstanding voting power voting as a single class is required for stockholders to amend or adopt any provision of our Bylaws. Issuance of Undesignated Preferred Stock
The Board generally has the authority, without further action by our stockholders, to issue up to 1,000,000,000 shares of undesignated preferred stock with rights and preferences, including voting rights, designated from time to time by the Board. The existence of authorized but unissued shares of preferred stock would enable the Board to render more difficult or to discourage an attempt to obtain control of us by means of a merger, tender offer, proxy contest or other means.
Exclusive Forum
Our Bylaws provide that, unless we consent in writing to the selection of an alternative forum, to the fullest extent permitted by law, the sole and exclusive forum for (i) any derivative action or proceeding brought on our behalf, (ii) any action asserting a claim of breach of a fiduciary duty owed by any of our directors, officers or other employees to us or our stockholders, (iii) any action arising pursuant to any provision of the Delaware General Corporation Law or our Certificate of Incorporation or Bylaws or (iv) any other action asserting a claim that is governed by the internal affairs doctrine shall be the Court of Chancery of the State of Delaware (or, if the Court of Chancery does not have jurisdiction, the federal district court for the District of Delaware), in all cases subject to the court having jurisdiction over indispensable parties named as defendants. Unless we consent in writing to the selection of an alternative forum, the federal district courts of the United States of America will be the sole and exclusive forum for the resolution of any complaint asserting a cause of action arising under the Securities Act against any person in connection with any offering of Aurora securities. Any person or entity purchasing or otherwise acquiring any interest in our securities shall be deemed to have notice of and consented to this provision. Although we believe these provisions benefit us by providing increased consistency in the application of applicable law for the specified types of actions and proceedings, the provisions may have the effect of discouraging lawsuits against us or our directors and officers.
Limitations of Liability and Indemnification
Our Certificate of Incorporation contains provisions that limit the liability of our directors for monetary damages to the fullest extent permitted by the Delaware General Corporation Law. Consequently, our directors
-137-
are not personally liable to us or our stockholders for monetary damages for any breach of fiduciary duties as directors, except liability for the following:
| • | any breach of their duty of loyalty to our company or our stockholders; |
| • | any act or omission not in good faith or that involves intentional misconduct or a knowing violation of law; |
| • | unlawful payments of dividends or unlawful stock repurchases or redemptions as provided in Section 174 of the Delaware General Corporation Law; or |
| • | any transaction from which they derived an improper personal benefit. |
Any amendment to, or repeal or elimination of, these provisions will not eliminate or reduce the effect of these provisions in respect of any act, omission or claim that occurred or arose prior to that amendment, repeal or elimination. If the Delaware General Corporation Law is amended to provide for further limitations on the personal liability of directors of corporations, then the personal liability of our directors will be further limited to the greatest extent permitted by the Delaware General Corporation Law.
In addition, our Bylaws provide that we will indemnify, to the fullest extent permitted by law, any person who is or was a party or is threatened to be made a party to any action, suit or proceeding by reason of the fact that such person is or was one of our directors or officers or is or was a director or officer of ours serving at our request as a director or officer of another corporation, partnership, joint venture, trust or other enterprise. Our Bylaws provide that we may indemnify to the fullest extent permitted by law any person who is or was a party or is threatened to be made a party to any action, suit or proceeding by reason of the fact that such person is or was one of our employees or agents or is or was serving at our request as an employee or agent of another corporation, partnership, joint venture, trust or other enterprise, or any other person, to the extent not prohibited by applicable law. Our Bylaws also provide that we must advance expenses incurred by or on behalf of a director or officer in advance of the final disposition of any action or proceeding, subject to limited exceptions.
Further, have entered into indemnification agreements with each of our directors and executive officers, which contain provisions broader than the specific indemnification provisions contained in the Delaware General Corporation Law. These indemnification agreements require us, among other things, to indemnify our directors and executive officers against liabilities that may arise by reason of their status or service. These indemnification agreements also generally require us to advance all expenses incurred by the directors and executive officers in investigating or defending any such action, suit or proceeding. We believe that these agreements are necessary to attract and retain qualified individuals to serve as directors and executive officers.
The limitation of liability and indemnification provisions included in our Certificate of Incorporation, in our Bylaws and in indemnification agreements that we have entered into with our directors and executive officers may discourage stockholders from bringing a lawsuit against our directors and executive officers for breach of their fiduciary duties. They may also reduce the likelihood of derivative litigation against our directors and executive officers, even though an action, if successful, might benefit us and other stockholders. Further, a stockholder’s investment may be adversely affected to the extent that we pay the costs of settlement and damage awards against directors and executive officers as required by these indemnification provisions. At present, we are not aware of any pending litigation or proceeding involving any person who is, was, or is expected be, one of our directors, officers, employees or other agents or is or was serving at our request as a director, officer, employee or agent of another corporation, partnership, joint venture, trust or other enterprise, for which indemnification is sought, and we are not aware of any threatened litigation that may result in claims for indemnification.
We have obtained insurance policies under which, subject to the limitations of the policies, coverage is provided to our directors and executive officers against loss arising from claims made by reason of breach of fiduciary duty or other wrongful acts as a director or executive officer, including claims relating to public
-138-
securities matters, and to us with respect to payments that may be made by us to these directors and executive officers pursuant to our indemnification obligations or otherwise as a matter of law.
Certain of our
non-employee
directors may, through their relationships with their employers, be insured or indemnified against certain liabilities incurred in their capacity as members of our board of directors. Insofar as indemnification for liabilities arising under the Securities Act may be permitted to directors, officers or persons controlling our company pursuant to the foregoing provisions, we have been informed that, in the opinion of the SEC, such indemnification is against public policy as expressed in the Securities Act and is therefore unenforceable.
Transfer Agent and Registrar and Warrant Agent
The transfer agent and registrar for our Class A Common Stock and our Class B Common Stock and the warrant agent for our Warrants is Continental Stock Transfer & Trust Company. The transfer agent’s address is 1 State Street, 30th Floor, New York, New York 10004-1561, and its telephone number is
(212) 509-4000.
Listing
The Class A Common Stock and Warrants are listed under the Nasdaq symbols “AUR” and “AUROW,” respectively.
-139-
SECURITIES ACT RESTRICTIONS ON RESALE OF SECURITIES
Rule 144
A person who has beneficially owned restricted shares of Class A Common Stock or Public Warrants for at least six months would be entitled to sell their securities provided that (i) such person is not deemed to have been one of our affiliates at the time of, or at any time during the three months preceding, a sale and (ii) we are subject to the Exchange Act periodic reporting requirements for at least three months before the sale. Persons who have beneficially owned restricted shares of Class A Common Stock or restricted Warrants for at least six months but who are our affiliates at the time of, or any time during the three months preceding, a sale, would be subject to additional restrictions, by which such person would be entitled to sell within any three-month period a number of securities that does not exceed the greater of:
| • | 1% of the then outstanding equity shares of the same class; and |
| • | the average weekly trading volume of Class A Common Stock or Warrants, as applicable, during the four calendar weeks preceding the date on which notice of the sale is filed with the SEC. |
Sales by affiliates of Aurora under Rule 144 are also subject to certain requirements relating to manner of sale, notice and the availability of current public information about Aurora.
Restrictions on the Use of Rule 144 by Shell Companies or Former Shell Companies
Rule 144 is not available for the resale of securities initially issued by shell companies (other than business combination related shell companies) or issuers that have been at any time previously a shell company. However, Rule 144 also includes an important exception to this prohibition if the following conditions are met:
| • | the issuer of the securities that was formerly a shell company has ceased to be a shell company; |
| • | the issuer of the securities is subject to the reporting requirements of Section 13 or 15(d) of the Exchange Act; |
| • | the issuer of the securities has filed all Exchange Act reports and material required to be filed, as applicable, during the preceding 12 months (or such shorter period that the issuer was required to file such reports and materials), other than Form 8-K reports; and |
| • | at least one year has elapsed from the time that the issuer filed current Form 10 type information with the SEC reflecting its status as an entity that is not a shell company. |
While we were formed as a shell company, since the completion of the Merger we are no longer a shell company, and so, once the conditions set forth in the exceptions listed above are satisfied, Rule 144 will become available for the resale of the above noted restricted securities.
Lock-Up
Agreement On the Closing Date, Aurora, the Sponsor, certain affiliates of the Sponsor and certain Legacy Aurora stockholders entered into a Lockup Agreement, effective at the Closing. Pursuant to the terms of the Lockup Agreement, the
lock-up
restrictions applicable to the Lock-Up
Shares held by the aforementioned parties begin at the Closing and end in tranches of 25% of the parties’ Lock-up
Shares at each of (i) the one year anniversary of Closing, (ii) the two-year anniversary of
the Closing, (iii) the three-year anniversary of the Closing and (iv) the four-year anniversary of the Closing. In addition, subject to certain exceptions, Legacy Aurora equityholders are subject to a
180-day
lock-up
provision pursuant to our Bylaws. -140-
MATERIAL U.S. FEDERAL INCOME TAX CONSIDERATIONS FOR
NON-U.S.
HOLDERS OF OUR COMMON STOCK The following is a summary of material U.S. federal income tax considerations of the ownership and disposition of our common stock acquired in this offering by a
“non-U.S.
holder” (as defined below) but does not purport to be a complete analysis of all the potential tax considerations relating thereto. This summary is based on the provisions of the Code, Treasury Regulations promulgated thereunder and administrative rulings and judicial decisions, all as of the date hereof. These authorities may be changed, possibly retroactively, so as to result in U.S. federal income tax considerations different from those set forth below. We have not sought, and do not intend to seek, any ruling from the Internal Revenue Service, or the IRS, with respect to the statements made and the conclusions reached in the following summary, and there can be no assurance that the IRS or a court will agree with such statements and conclusions. This summary also does not address the tax considerations arising under the laws of any U.S. state or local or
non-U.S.
jurisdiction or under U.S. federal gift and estate tax rules, or the effect, if any, of the Medicare contribution tax on net investment income. In addition, this discussion does not address tax considerations applicable to an investor’s particular circumstances or to investors that may be subject to special tax rules, including, without limitation: | • | banks, insurance companies, regulated investment companies, real estate investment trusts or other financial institutions; |
| • | persons subject to the alternative minimum tax; |
| • | tax-exempt or governmental organizations; |
| • | pension plans and tax-qualified retirement plans; |
| • | controlled foreign corporations, passive foreign investment companies and corporations that accumulate earnings to avoid U.S. federal income tax; |
| • | entities or arrangements classified as partnerships for U.S. federal income tax purposes or other pass-through entities (or investors in such entities or arrangements); |
| • | brokers or dealers in securities or currencies; |
| • | traders in securities that elect to use a mark-to-market |
| • | persons who own, or are deemed to own, more than five percent of our capital stock (except to the extent specifically set forth below); |
| • | certain former citizens or long-term residents of the United States; |
| • | persons who hold our common stock as a position in a hedging transaction, “straddle,” “conversion transaction,” or other risk reduction transaction; |
| • | persons who hold or receive our common stock pursuant to the exercise of any option or otherwise as compensation; |
| • | persons who do not hold our common stock as a capital asset within the meaning of Section 1221 of the Code (generally, property held for investment); |
| • | persons deemed to sell our common stock under the constructive sale provisions of the Code; or |
| • | persons subject to special tax accounting rules as a result of any item of gross income with respect to our common stock being taken into account in an “applicable financial statement” as defined in Section 451(b) of the Code. |
-141-
In addition, if a partnership (or other entity or arrangement classified as a partnership for U.S. federal income tax purposes) holds our common stock, the tax treatment of a partner in the partnership generally will depend on the status of the partner and upon the activities of the partnership. A partner in a partnership that will hold our common stock should consult his, her or its own tax advisor regarding the tax considerations of the ownership and disposition of our common stock through a partnership.
You are urged to consult your tax advisor with respect to the application of the U.S. federal income tax laws to your particular situation, as well as any tax considerations of the ownership and disposition of our common stock arising under the U.S. federal gift or estate tax rules or under the laws of any U.S. state or local,
non-U.S.
or other taxing jurisdiction or under any applicable income tax treaty. Non-U.S.
Holder Defined For purposes of this discussion, you are a
“non-U.S.
holder” if you are a beneficial owner of our common stock that, for U.S. federal income tax purposes, is neither a partnership nor: | • | an individual who is a citizen or resident of the United States; |
| • | a corporation or other entity taxable as a corporation created or organized in the United States or under the laws of the United States or any political subdivision thereof, or otherwise treated as such for U.S. federal income tax purposes; |
| • | an estate whose income is subject to U.S. federal income tax regardless of its source; or |
| • | a trust (x) whose administration is subject to the primary supervision of a U.S. court and that has one or more U.S. persons who have the authority to control all substantial decisions of the trust or (y) that has made a valid election under applicable Treasury Regulations to be treated as a U.S. person. |
Dividends
As described in the section titled “,” we have never declared or paid cash dividends on our common stock, and we do not anticipate paying any dividends on our common stock following the completion of this offering. However, if we do make distributions on our common stock, those payments will constitute dividends for U.S. federal income tax purposes to the extent paid from our current or accumulated earnings and profits, as determined under U.S. federal income tax principles. To the extent those distributions exceed both our current and our accumulated earnings and profits, the excess will constitute a return of capital and will first reduce your basis in our common stock, but not below zero, and then will be treated as gain from the sale of stock as described below under .”
Dividend Policy
“—Gain on Disposition of Common Stock
Subject to the discussions below regarding effectively connected income, backup withholding and FATCA, any dividend paid to you generally will be subject to U.S. federal withholding tax either at a rate of 30% of the gross amount of the dividend or such lower rate as may be specified by an applicable income tax treaty between the United States and your country of residence. In order to receive a reduced treaty rate, you must provide us or the applicable paying agent with an IRS or other appropriate version of IRS
Form W-8BEN
or W-8BEN-E
Form W-8
certifying qualification for the reduced rate. Under applicable Treasury Regulations, we may withhold up to 30% of the gross amount of the entire distribution even if the amount constituting a dividend, as described above, is less than the gross amount. You may obtain a refund of any excess amounts withheld by filing an appropriate claim for refund with the IRS. If you hold our common stock through a financial institution or other agent acting on your behalf, you will be required to provide appropriate documentation to the agent, which then will be required to provide certification to us or our paying agent, either directly or through other intermediaries. Dividends received by you that are treated as effectively connected with your conduct of a U.S. trade or business (and, if required by an applicable income tax treaty, that are attributable to a permanent establishment or fixed base maintained by you in the United States) are generally exempt from the 30% U.S. federal withholding
-142-
tax, subject to the discussions below regarding backup withholding and FATCA. In order to obtain this exemption, you must provide us with a properly executed IRS
Form W-8ECI
or other applicable IRS Form W-8
properly certifying such exemption. Such effectively connected dividends, although not subject to U.S. federal withholding tax, generally are taxed at the U.S. federal income tax rates applicable to U.S. persons, net of certain deductions and credits. In addition, if you are a corporate non-U.S.
holder, dividends you receive that are effectively connected with your conduct of a U.S. trade or business may also be subject to a branch profits tax at a rate of 30% or such lower rate as may be specified by an applicable income tax treaty between the United States and your country of residence. You should consult your tax advisor regarding the tax consequences of the ownership and disposition of our common stock, including the application of any applicable tax treaties that may provide for different rules. Gain on Disposition of Common Stock
Subject to the discussions below regarding backup withholding and FATCA, you generally will not be required to pay U.S. federal income tax on any gain realized upon the sale or other disposition of our common stock unless:
| • | the gain is effectively connected with your conduct of a U.S. trade or business (and, if an applicable income tax treaty so provides, the gain is attributable to a permanent establishment or fixed base maintained by you in the United States); |
| • | you are an individual who is present in the United States for a period or periods aggregating 183 days or more during the calendar year in which the sale or disposition occurs and certain other conditions are met; or |
| • | our common stock constitutes a United States real property interest by reason of our status as a “United States real property holding corporation,” or a USRPHC, for U.S. federal income tax purposes at any time within the shorter of the five-year period preceding your disposition of, or your holding period for, our common stock. |
We believe that we are not currently and will not become a USRPHC for U.S. federal income tax purposes, and the remainder of this discussion so assumes. However, because the determination of whether we are a USRPHC depends on the fair market value of our U.S. real property interests relative to the fair market value of our U.S. and worldwide real property interests plus our other assets used or held for use in a trade or business, there can be no assurance that we will not become a USRPHC in the future. Even if we become a USRPHC, however, as long as our common stock is regularly traded on an established securities market, your common stock will be treated as U.S. real property interests only if you actually (directly or indirectly) or constructively hold more than five percent of our regularly traded common stock at any time during the shorter of the five-year period preceding your disposition of, or your holding period for, our common stock.
If you are a
non-U.S.
holder described in the first bullet above, you generally will be required to pay tax on the gain derived from the sale (net of certain deductions and credits) under U.S. federal income tax rates applicable to U.S. persons, and a corporate non-U.S.
holder described in the first bullet above also may be subject to the branch profits tax at a 30% rate, or such lower rate as may be specified by an applicable income tax treaty. If you are an individual non-U.S.
holder described in the second bullet above, you will be subject to tax at 30% (or such lower rate specified by an applicable income tax treaty) on the gain derived from the sale, which gain may be offset by U.S. source capital losses for the year, provided you have timely filed U.S. federal income tax returns with respect to such losses. You should consult your tax advisor regarding any applicable income tax or other treaties that may provide for different rules. Backup Withholding and Information Reporting
Generally, we must report annually to the IRS the amount of dividends paid to you, your name and address and the amount of tax withheld, if any. A similar report will be sent to you. Pursuant to applicable income tax treaties or other agreements, the IRS may make these reports available to tax authorities in your country of residence.
-143-
Payments of dividends on or of proceeds from the disposition of our common stock made to you may be subject to backup withholding at the applicable statutory rate unless you establish an exemption, for example, by properly certifying your or another appropriate version of IRS
non-U.S.
status on a properly completed IRS Form W-8BEN
or W-8BEN-E
Form W-8.
Notwithstanding the foregoing, backup withholding and information reporting may apply if either we or our paying agent has actual knowledge, or reason to know, that you are a U.S. person. Backup withholding is not an additional tax; rather, the U.S. federal income tax liability of persons subject to backup withholding will be reduced by the amount of tax withheld. If withholding results in an overpayment of taxes, a refund or credit may generally be obtained from the IRS, provided that the required information is furnished to the IRS in a timely manner.
Additional Withholding Requirements under the Foreign Account Tax Compliance Act
Subject to the following paragraph, the Foreign Account Tax Compliance Act and the Treasury Regulations and other official IRS guidance issued thereunder (collectively, “FATCA”) generally imposes a U.S. federal withholding tax of 30% on dividends on, and the gross proceeds from a sale or other disposition of, our common stock, paid to a “foreign financial institution” (as specially defined under these rules), unless such institution enters into an agreement with the U.S. government to, among other things, withhold on certain payments and to collect and provide to the U.S. tax authorities substantial information regarding the U.S. account holders of such institution (which includes certain equity and debt holders of such institution, as well as certain account holders that are
non-U.S.
entities with U.S. owners) or otherwise establishes an exemption. Subject to the following paragraph, FATCA also generally imposes a U.S. federal withholding tax of 30% on dividends on, and the gross proceeds from a sale or other disposition of, our common stock paid to a “non-financial
foreign entity” (as specially defined under these rules) unless such entity provides the withholding agent with a certification identifying the substantial direct and indirect U.S. owners of the entity, certifies that it does not have any substantial U.S. owners, or otherwise establishes an exemption. The withholding tax will apply regardless of whether the payment otherwise would be exempt from the U.S. nonresident withholding tax described above and backup withholding, including under the exemptions described above. Under certain circumstances, you might be eligible for refunds or credits of such taxes. An intergovernmental agreement between the United States and your country of residence may modify the requirements described in this section. You should consult with your own tax advisors regarding the application of FATCA to your ownership and disposition of our common stock. The U.S. Treasury Department has issued proposed regulations that, if finalized in their present form, would eliminate FATCA withholding on gross proceeds of the sale or other disposition of our common stock (but not on payments of dividends). The preamble of such proposed regulations states that they may be relied upon by taxpayers until final regulations are issued or until such proposed regulations are rescinded.
The preceding discussion of U.S. federal income tax considerations is for general information only. It is not tax advice to investors in their particular circumstances. You should consult your own tax advisor regarding the particular U.S. federal, state and local and
non-U.S.
tax considerations of owning and disposing of our common stock, including the consequences of any proposed change in applicable laws. -144-
PLAN OF DISTRIBUTION
We are registering the issuance by us of up to 8,900,000 shares of our Class A Common Stock issuable upon the exercise of the Private Placement Warrants and up to 12,218,750 shares of our Class A Common Stock issuable upon the exercise of the Public Warrants. We are also registering securities for resale by the Selling Securityholders. As used herein, references to “Selling Securityholders” includes donees, pledgees, transferees, distributees or other selling shares of Class A Common Stock or Warrants or interests in the Securities received after the date of this prospectus from a Selling Securityholder as a gift, pledge, partnership distribution or other transfer.
successors-in-interest
| • | We will not receive any of the proceeds of the sale of the Securities offered by this prospectus. We will receive up to an aggregate of approximately $244.1 million from the exercise of the Warrants, assuming the exercise in full of all of the Warrants for cash and from the exercise of the Affiliate Options and the Former Employee Options. The aggregate proceeds to the Selling Securityholders from the sale of the Securities will be the purchase price of the Securities less any discounts and commissions. We will not pay any brokers’ or underwriters’ discounts and commissions in connection with the registration and sale of the Securities covered by this prospectus. The Selling Securityholders reserve the right to accept and, together with their respective agents, to reject, any proposed purchases of Securities to be made directly or through agents. |
The Securities offered by this prospectus may be sold from time to time to purchasers:
| • | directly by the Selling Securityholders; |
| • | through underwriters, broker-dealers or agents, who may receive compensation in the form of discounts, commissions or agent’s commissions from the Selling Securityholders or the purchasers of the Securities; or |
| • | through a combination of any of these methods of sale. |
Any underwriters, broker-dealers or agents who participate in the sale or distribution of the Securities may be deemed to be “underwriters” within the meaning of the Securities Act. As a result, any discounts, commissions or concessions received by any such broker-dealer or agents who are deemed to be underwriters will be deemed to be underwriting discounts and commissions under the Securities Act. Underwriters are subject to the prospectus delivery requirements of the Securities Act and may be subject to certain statutory liabilities under the Securities Act and the Exchange Act. We will make copies of this prospectus available to the Selling Securityholders for the purpose of satisfying the prospectus delivery requirements of the Securities Act. To our knowledge, there are currently no plans, arrangements or understandings between the Selling Securityholders and any underwriter, broker-dealer or agent regarding the sale of the Securities by the Selling Securityholders.
The securities may be sold in one or more transactions at:
| • | fixed prices; |
| • | prevailing market prices at the time of sale; |
| • | prices related to such prevailing market prices; |
| • | varying prices determined at the time of sale; or |
| • | negotiated prices. |
These sales may be effected in one or more transactions:
| • | through one or more underwritten offerings on a firm commitment or best efforts basis; |
| • | settlement of short sales entered into after the date of this prospectus; |
-145-
| • | agreements with broker-dealers to sell a specified number of the securities at a stipulated price per share; |
| • | in “at the market” offerings, as defined in Rule 415 under the Securities Act, at negotiated prices, at prices prevailing at the time of sale or at prices related to such prevailing market prices, including sales made directly on a national securities exchange or sales made through a market maker other than on an exchange or other similar offerings through sales agents; |
| • | in privately negotiated transactions; |
| • | in options or other hedging transactions, whether through an options exchange or otherwise; |
| • | in distributions to members, limited partners or stockholders of Selling Securityholders; |
| • | any other method permitted by applicable law; |
| • | on any national securities exchange or quotation service on which the Securities may be listed or quoted at the time of sale, including Nasdaq; |
| • | in the over-the-counter |
| • | in transactions otherwise than on such exchanges or services or in the over-the-counter |
| • | any other method permitted by applicable law; or |
| • | through any combination of the foregoing. |
These transactions may include block transactions or crosses. Crosses are transactions in which the same broker acts as an agent on both sides of the trade.
In connection with distributions of the Securities or otherwise, the Selling Securityholders may enter into hedging transactions with broker-dealers or other financial institutions. In connection with such transactions, broker-dealers or other financial institutions may engage in short sales of the Securities in the course of hedging transactions, broker-dealers or other financial institutions may engage in short sales of the Securities in the course of hedging the positions they assume with Selling Securityholders. The Selling Securityholders may also sell the Securities short and redeliver the Securities to close out such short positions. The Selling Securityholders may also enter into option or other transactions with broker-dealers or other financial institutions which require the delivery to such broker-dealer or other financial institution of the Securities offered by this prospectus, which Securities such broker-dealer or other financial institution may resell pursuant to this prospectus (as supplemented or amended to reflect such transaction). The Selling Securityholders may also pledge the Securities to a broker-dealer or other financial institution, and, upon a default, such broker-dealer or other financial institution, may effect sales of the pledged Securities pursuant to this prospectus (as supplemented or amended to reflect such transaction).
A Selling Securityholder may enter into derivative transactions with third parties, or sell securities not covered by this prospectus to third parties in privately negotiated transactions. If the applicable prospectus supplement indicates, in connection with those derivatives, the third parties may sell the Securities covered by this prospectus and the applicable prospectus supplement, including in short sale transactions. If so, the third party may use securities pledged by any Selling Securityholder or borrowed from any Selling Securityholder or others to settle those sales or to close out any related open borrowings of stock, and may use securities received from any Selling Securityholder in settlement of those derivatives to close out any related open borrowings of stock. The third party in such sale transactions will be an underwriter and will be identified in the applicable prospectus supplement (or a post-effective amendment). In addition, any Selling Securityholder may otherwise loan or pledge the Securities to a financial institution or other third party that in turn may sell the Securities short using this prospectus. Such financial institution or other third party may transfer its economic short position to investors in our securities or in connection with a concurrent offering of other securities.
At the time a particular offering of the Securities is made, a prospectus supplement, if required, will be distributed, which will set forth the name of the Selling Securityholders, the aggregate amount of Securities being
-146-
offered and the terms of the offering, including, to the extent required, (1) the name or names of any underwriters, broker-dealers or agents, (2) any discounts, commissions and other terms constituting compensation from the Selling Securityholders and (3) any discounts, commissions or concessions allowed or reallowed to be paid to broker-dealers. We may suspend the sale of Securities by the Selling Securityholders pursuant to this prospectus for certain periods of time for certain reasons, including if the prospectus is required to be supplemented or amended to include additional material information.
The Selling Securityholders also may transfer the securities in other circumstances, in which case the transferees, pledgees or other will be the selling beneficial owners for purposes of this prospectus. Upon being notified by a Selling Securityholder that a donee, pledgee, transferee, other intends to sell our Securities, we will, to the extent required, promptly file a supplement to this prospectus to name specifically such person as a Selling Securityholder.
successors-in-interest
successor-in-interest
The Selling Securityholders will act independently of us in making decisions with respect to the timing, manner, and size of each resale or other transfer. There can be no assurance that the Selling Securityholders will sell any or all of the Securities under this prospectus. Further, we cannot assure you that the Selling Securityholders will not transfer, distribute, devise or gift the Securities by other means not described in this prospectus. In addition, any Securities covered by this prospectus that qualify for sale under Rule 144 of the Securities Act may be sold under Rule 144 rather than under this prospectus. The Securities may be sold in some states only through registered or licensed brokers or dealers. In addition, in some states the Securities may not be sold unless they have been registered or qualified for sale or an exemption from registration or qualification is available and complied with.
The Selling Securityholders may, from time to time, pledge or grant a security interest in some shares of the Securities owned by them and, if a Selling Securityholder defaults in the performance of its secured obligations, the pledgees or secured parties may offer and sell such shares of the Securities, from time to time, under this prospectus, or under an amendment or supplement to this prospectus amending the list of the Selling Securityholders to include the pledgee, transferee or other successors in interest as the Selling Securityholders under this prospectus. The Selling Securityholders also may transfer shares of the Securities in other circumstances, in which case the transferees, pledgees or other successors in interest will be the selling beneficial owners for purposes of this prospectus.
A Selling Securityholder that is an entity may elect to make an
in-kind
distribution of the Securities to its members, partners or shareholders pursuant to the registration statement of which this prospectus is a part by delivering a prospectus. To the extent that such members, partners or shareholders are not affiliates of ours, such members, partners or stockholders would thereby receive freely tradable shares of the Securities pursuant to the distribution through a registration statement. The Selling Securityholders may, from time to time, pledge or grant a security interest in some shares of the Securities owned by them and, if a Selling Securityholder defaults in the performance of its secured obligations, the pledgees or secured parties may offer and sell such shares of the Securities, from time to time, under this prospectus, or under an amendment or supplement to this prospectus amending the list of the Selling Securityholders to include the pledgee, transferee or other successors in interest as the Selling Securityholders under this prospectus. The Selling Securityholders also may transfer shares of the Securities in other circumstances, in which case the transferees, pledgees or other successors in interest will be the selling beneficial owners for purposes of this prospectus.
A Selling Securityholder that is an entity may elect to make an
in-kind
distribution of the Securities to its members, partners or shareholders pursuant to this prospectus by delivering a prospectus. To the extent that such members, partners or shareholders are not affiliates of ours, such members, partners or stockholders would thereby receive freely tradable shares of the Securities pursuant to the distribution through this prospectus. -147-
For additional information regarding expenses of registration, see the section titled “” appearing elsewhere in this prospectus.
Use of Proceeds
Lock-Up
Restrictions Of the shares of Class A Common Stock that may be offered or sold by Selling Securityholders identified in this prospectus, of those shares (the ” appearing elsewhere in this prospectus.
“Lock-Up
Shares”), which include shares of Class A Common Stock issuable upon the exercise or vesting of outstanding equity awards and upon conversion of Class B Common Stock, are subject to certain lock-up
restrictions, pursuant to our bylaws and/or other agreements further described in the section titled “Certain Relationships and Related Person Transactions
-148-
LEGAL MATTERS
The validity of the Securities offered hereby has been passed upon for us by Wilson Sonsini Goodrich & Rosati, Professional Corporation, New York, New York, which has acted as our counsel in connection with this offering. Certain members of, and investment partnerships comprised of members of, and persons associated with, Wilson Sonsini Goodrich & Rosati, Professional Corporation, directly or indirectly own less than 1% of the outstanding shares of our common stock.
EXPERTS
The financial statements of RTPY as of December 31, 2020, and for the period from October 2, 2020 (inception) through December 31, 2020, included in this prospectus have been audited by WithumSmith+Brown, PC, independent registered public accounting firm, as stated in their report thereon and appearing elsewhere herein, in reliance upon such report and upon the authority of such firm as experts in accounting and auditing.
The financial statements of Aurora Innovation, Inc. as of December 31, 2020 and 2019, and for each of the years in the
two-year
period ended December 31, 2020, included herein in reliance upon the report of KPMG LLP, independent registered public accounting firm, appearing elsewhere herein, and upon authority of said firm as experts in accounting and auditing. The financial statements of Apparate USA LLC as of December 31, 2020 and December 31, 2019 and for the year ended December 31, 2020 and for the period from April 8, 2019 to December 31, 2019 included in this prospectus have been so included in reliance on the report of PricewaterhouseCoopers LLP, independent accountants, given on the authority of said firm as experts in auditing and accounting.
Change in Certifying Accountant
On November 3, 2021, Withum, who served as RTPY’s independent registered public accounting firm prior to the Merger, was informed that it would be dismissed as the Company’s independent registered public accounting firm following its review of RTPY’s quarter ended September 30, 2021, which consists only of the
pre-Merger
accounts of RTPY pre-Merger.
Subsequently, on November 3, 2021, the Audit Committee of the Board approved the engagement of KPMG as the Company’s independent registered public accounting firm to audit the Company’s consolidated financial statements for the year ending December 31, 2021. KPMG previously served as the independent registered public accounting firm for Legacy Aurora, which was acquired by RTPY on November 3, 2021. The report of Withum on RTPY’s financial statements as of December 31, 2020 and for the period from October 2, 2020 (RTPY’s inception) through December 31, 2020, did not contain an adverse opinion or a disclaimer of opinion, and were not qualified or modified as to uncertainties, audit scope or accounting principles.
During the period from October 2, 2020 (RTPY’s inception) to December 31, 2020 and the subsequent interim period through November 3, 2021, there were no “disagreements” (as such term is defined in Item 304(a)(1)(iv) of
Regulation S-K
and the related instructions) with Withum on any matter of accounting principles or practices, financial statement disclosure, or auditing scope or procedures, which disagreements, if not resolved to the satisfaction of Withum, would have caused Withum to make reference thereto in its report on RTPY’s pre-Merger
financial statements as of December 31, 2020 and for the period from October 2, 2020 (RTPY’s inception) to December 31, 2020. During the period from October 2, 2020 (RTPY’s inception) to December 31, 2020 and the subsequent interim period through November 3, 2021, there have been no “reportable events” (as -149-
such term is defined in Item 304(a)(1)(v) of
Regulation S-K),
except for a material weakness in RTPY’s pre-Merger
internal control over financial reporting related to the accounting for a significant and unusual transaction related to the warrants RTPY issued in connection with the RTPY IPO. During the period from October 2, 2020 (RTPY’s inception) through November 3, 2021, neither RTPY nor anyone on its behalf consulted KPMG regarding either: (i) the application of accounting principles to a specified transaction, either completed or proposed; or the type of audit opinion that might be rendered on RTPY’s financial statements, and neither a written report was provided to RTPY or oral advice was provided that KPMG concluded was an important factor considered by RTPY in reaching a decision as to the accounting, auditing, or financial reporting issue; or (ii) any matter that was the subject of a disagreement (as described in Item 304(a)(1)(iv) of
Regulation S-K)
or a “reportable event,” as described in Item 304(a)(1)(v) of Regulation S-K.
RTPY previously provided Withum with a copy of the foregoing disclosures prior to the filing of a Current Report on
Form 8-K
on November 3, 2021 and requested that Withum furnish a letter addressed to the Securities and Exchange Commission, as required by Item 304(a)(3) of Regulation S-K,
which is incorporated by reference into the registration statement of which this prospectus forms a part as Exhibit 16.1, stating whether it agrees with such disclosures, and if not, stating the respects in which it does not agree. WHERE YOU CAN FIND ADDITIONAL INFORMATION
We have filed with the SEC a registration statement on
Form S-1
under the Securities Act that registers the shares of our Class A Common Stock and the Private Placement Warrants to be offered by this prospectus. This prospectus constitutes only a part of the registration statement. Some items are contained in exhibits to the registration statement as permitted by the rules and regulations of the SEC. For further information with respect to us and our securities, we refer you to the registration statement, including the exhibits filed as a part of the registration statement. Statements contained in this prospectus concerning the contents of any contract or document referred to are not necessarily complete. If a contract or document has been filed as an exhibit to the registration statement, please see the copy of the contract or document that has been filed. Each statement in this prospectus relating to a contract or document filed as an exhibit is qualified in all respects by the filed exhibit. We file annual, quarterly and current reports, proxy statements and other information with the SEC. The SEC maintains an Internet website at that contains reports, proxy and information statements and other information about issuers, like us, that file electronically with the SEC. We also maintain a website at . We make available, free of charge, on our investor relations website at https://aurora.tech/ir
www.sec.gov
www.aurora.tech
,
our Annual Reports on Form 10-K,
Quarterly Reports on Form 10-Q,
Current Reports on Form 8-K
and amendments to these reports as soon as reasonably practicable after electronically filing or furnishing those reports to the SEC. Information contained on our website is not a part of or incorporated by reference into this prospectus and the inclusion of our website and investor relations website addresses in this prospectus is an inactive textual reference only. -150-
REINVENT TECHNOLOGY PARTNERS Y
INDEX TO FINANCIAL STATEMENTS
| Page | ||
| As of December 31, 2020 |
||
F-2 | ||
F-3 | ||
F-4 | ||
F-5 | ||
F-6 | ||
F-7 | ||
| As of June 30, 2021 |
||
F-17 | ||
F-18 | ||
F-19 | ||
F-20 | ||
F-21 |
AURORA
INDEX TO CONSOLIDATED FINANCIAL STATEMENTS
Page | ||
| As of December 31, 2019 and December 31, 2020 |
||
F-39 | ||
F-40 | ||
F-41 | ||
F-42 | ||
F-43 | ||
F-44 | ||
F-45 | ||
| As of June 30, 2021 |
||
F-66 | ||
F-67 | ||
F-68 | ||
F-69 | ||
F-71 | ||
F-72 |
APPARATE
INDEX TO CONSOLIDATED FINANCIAL STATEMENTS
Page | ||
| As of December 31, 2019 and 2020 |
||
F-88 | ||
F-89 | ||
F-90 | ||
F-91 | ||
F-92 | ||
F-93 |
F-1
Report of Independent Registered Public Accounting Firm
To the Shareholders and Director
Reinvent Technology Partners Y
Opinion on the Financial Statements
We have audited the accompanying balance sheet of Reinvent Technology Partners Y (the “Company”) as of December 31, 2020, the related statements of operations, changes in shareholder’s equity and cash flows for the period from October 2, 2020 (inception) through December 31, 2020, and the related notes (collectively referred to as the “financial statements”). In our opinion, the financial statements present fairly, in all material respects, the financial position of the Company as of December 31, 2020 and the results of its operations and its cash flows for the period from October 2, 2020 (inception) through December 31, 2020, in conformity with accounting principles generally accepted in the United States of America.
Basis for Opinion
These financial statements are the responsibility of the Company’s management. Our responsibility is to express an opinion on the Company’s financial statements based on our audit. We are a public accounting firm registered with the Public Company Accounting Oversight Board (United States) (the “PCAOB”) and are required to be independent with respect to the Company in accordance with the U.S. federal securities laws and the applicable rules and regulations of the Securities and Exchange Commission and the PCAOB.
We conducted our audit in accordance with the standards of the PCAOB. Those standards require that we plan and perform the audit to obtain reasonable assurance about whether the financial statements are free of material misstatement, whether due to error or fraud. The Company is not required to have, nor were we engaged to perform, an audit of its internal control over financial reporting. As part of our audit we are required to obtain an understanding of internal control over financial reporting but not for the purpose of expressing an opinion on the effectiveness of the Company’s internal control over financial reporting. Accordingly, we express no such opinion.
Our audit included performing procedures to assess the risks of material misstatement of the financial statements, whether due to error or fraud, and performing procedures that respond to those risks. Such procedures included examining, on a test basis, evidence regarding the amounts and disclosures in the financial statements. Our audit also included evaluating the accounting principles used and significant estimates made by management, as well as evaluating the overall presentation of the financial statements. We believe that our audit provide a reasonable basis for our opinion.
/s/ WithumSmith+Brown, PC
We have served as the Company’s auditor since 2020.
New York, New York
February 12, 2021
F-2
REINVENT TECHNOLOGY PARTNERS Y
BALANCE SHEET
December 31, 2020
| Assets: |
||||
| Current assets: |
||||
| Prepaid expenses |
$ | |||
| |
|
|||
| Total current assets |
||||
| Deferred offering costs associated with proposed public offering |
||||
| |
|
|||
| Total Assets |
$ |
|||
| |
|
|||
| Liabilities and Shareholder’s Equity: |
||||
| Current liabilities: |
||||
| Accounts payable |
$ | |||
| Accrued expenses |
||||
| |
|
|||
| Total current liabilities |
$ | |||
| |
|
|||
| Commitments and Contingencies |
||||
| Shareholder’s Equity: |
||||
| Preference shares, $ |
|
|||
| Class A ordinary shares, $ |
— | |||
| Class B ordinary shares, $ (1)
(2)
|
||||
| Additional paid-in capital |
||||
| Accumulated deficit |
( |
) | ||
| |
|
|||
| Total shareholder’s equity |
||||
| |
|
|||
| Total Liabilities and Shareholder’s Equity |
$ |
|||
| |
|
| (1) | This number includes up to |
| (2) | On February 10, 2021, the Company effected a share capitalization resulting in an aggregate of |
The accompanying notes are an integral part of these financial statements.
F-3
REINVENT TECHNOLOGY PARTNERS Y
STATEMENT OF OPERATIONS
For the period from October 2, 2020 (inception) through December 31, 2020
General and administrative expenses |
$ | |||
Net loss |
$ | ( |
) | |
Weighted average ordinary shares outstanding, basic and diluted (1)(2)
|
||||
Basic and diluted net loss per ordinary share |
$ | ( |
) | |
| (1) | This number excludes an aggregate of up to |
| (2) | On February 10, 2021, the Company effected a share capitalization resulting in an aggregate of |
The accompanying notes are an integral part of these financial statements.
F-4
REINVENT TECHNOLOGY PARTNERS Y
STATEMENT OF CHANGE IN SHAREHOLDER'S EQUITY
For the period from October 2, 2020 (inception) through December 31, 2020
Ordinary Shares |
Additional Paid-in Capital |
Accumulated Deficit |
Total Shareholder's Equity |
|||||||||||||||||||||||||
Class A |
Class B |
|||||||||||||||||||||||||||
Shares |
Amount |
Shares |
Amount |
|||||||||||||||||||||||||
| Balance—October 2, 2020 (inception) |
$ |
$ |
$ |
$ |
$ |
|||||||||||||||||||||||
| Issuance of Class B ordinary shares to Sponsor (1)
(2)
|
||||||||||||||||||||||||||||
| Net loss |
— | — | — | — | — | ( |
) | ( |
) | |||||||||||||||||||
| |
|
|
|
|
|
|
|
|
|
|
|
|
|
|||||||||||||||
| Balance—December 31, 2020 |
$ |
$ |
$ |
$ |
( |
) |
$ |
|||||||||||||||||||||
| |
|
|
|
|
|
|
|
|
|
|
|
|
|
|||||||||||||||
| (1) | This number includes up to |
| (2) | On February 10, 2021, the Company effected a share capitalization resulting in an aggregate of |
The accompanying notes are an integral part of these financial statements.
F-5
REINVENT TECHNOLOGY PARTNERS Y
STATEMENT OF CASH FLOWS
For the period from October 2, 2020 (inception) through December 31, 2020
| Cash Flows from Operating Activities: |
||||
| Net loss |
$ | ( |
) | |
| Changes in operating assets and liabilities: |
||||
| Prepaid expenses |
||||
| |
|
|||
| Net cash used in operating activities |
||||
| |
|
|||
| Net increase in cash |
||||
| Cash—beginning of the period |
||||
| |
|
|||
| Cash—ending of the period |
$ |
|||
| |
|
|||
| Supplemental disclosure of noncash investing and financing activities: |
||||
| Prepaid expenses paid by Sponsor in exchange for issuance of Class B ordinary shares |
$ | |||
| Deferred offering costs included in accrued expenses |
$ | |||
| Deferred offering costs included in accounts payable |
$ |
The accompanying not
e
s are an integral part of these financial statements. F-6
REINVENT TECHNOLOGY PARTNERS Y
NOTES TO FINANCIAL STATEMENTS
Note 1. Description of Organization, Business Operations and Basis of Presentation
Reinvent Technology Partners Y, formerly known as Reinvent Technology Partners C (the “Company”), is a blank check company incorporated as a Cayman Islands exempted company on October 2, 2020 . The Company was incorporated for the purpose of effecting a merger, share exchange, asset acquisition, share purchase, reorganization or similar business combination with one or more businesses that the Company has not yet identified (“Business Combination”).
As of December 31, 2020, the Company had not yet commenced operations. All activity for the period from October 2, 2020 (inception) through December 31, 2020 relates to the Company’s formation and the Proposed Public Offering, which is described below. The Company will not generate any operating revenues until after the completion of its initial Business Combination, at the earliest. The Company will generate non-operating income in the form of interest income from the proceeds derived from the Proposed Public Offering. The Company has selected December 31 as its fiscal year end.
The Company’s ability to commence operations is contingent upon obtaining adequate financial resources through a proposed initial public offering of 85,000,000 units at $10.00 per unit (or 97,750,000 units if the underwriters’ option to purchase additional units is exercised in full) (“Units” and, with respect to the Class A ordinary shares included in such Units, the “Public Shares”) which is discussed in Note 3 (the “Proposed Public Offering”) and the sale of 7,880,000 warrants (or 8,900,000 warrants if the underwriters’ option to purchase additional units is exercised in full) at a price of $2.50 per warrant (“Private Placement Warrants”) in a private placement (the “Private Placement”) to the Company’s sponsor, Reinvent Sponsor Y LLC, a Cayman Islands limited liability company (“Sponsor”), that will close simultaneously with the Proposed Public Offering.
The Company’s management has broad discretion with respect to the specific application of the net proceeds of its Proposed Public Offering and the sale of Private Placement Warrants, although substantially all of the net proceeds are intended to be applied generally toward consummating a Business Combination. The Company’s initial Business Combination must be with one or more target businesses with an aggregate fair market value equal to at least 80 % of the value of the Trust Account (as defined below) (excluding any deferred underwriting commissions and taxes payable on interest earned on the trust account) at the time of our signing a definitive agreement in connection with our initial Business Combination. However, the Company will only complete a Business Combination if the post-transaction company owns or acquires 50 % or more of the outstanding voting securities of the target or otherwise acquires a controlling interest in the target sufficient for it not to be required to register as an investment company under the Investment Company Act of 1940, as amended, or the Investment Company Act. Upon the closing of the Proposed Public Offering, management has agreed that an amount equal to at least $10.00 per Unit sold in the Proposed Public Offering, including the proceeds of the Private Placement Warrants, will be held in a trust account (“Trust Account”) with Continental Stock Transfer & Trust Company acting as trustee and invested in United States government treasury bills with a maturity of 185 days or less or in money market funds investing solely in U.S. Treasuries and meeting certain conditions under Rule
2a-7
under the Investment Company Act, as determined by the Company, until the earlier of: (i) the completion of a Business Combination and (ii) the distribution of the Trust Account as described below. The Company will provide its holders of Public Shares (the “Public Shareholders”) with the opportunity to redeem all or a portion of their Public Shares upon the completion of a Business Combination either (i) in connection with a general meeting called to approve the Business Combination or (ii) by means of a tender offer. The decision as to whether the Company will seek shareholder approval of a Business Combination or conduct a tender offer will be made by the Company, solely in its discretion. The Public Shareholders will be entitled to redeem their Public Shares for a pro rata portion of the amount then in the Trust Account (initially anticipated to be $10.00 per share, plus any pro rata interest earned on the funds held in the Trust Account and not previously released to the Company to pay its tax obligations). The
per-share
amount to be distributed to Public Shareholders who redeem their Public Shares will not be reduced by the deferred underwriting commissions the F-7
Company will pay to the underwriters (as discussed in Note 6). These Public Shares will be recorded at a redemption value and classified as temporary equity upon the completion of the Proposed Public Offering, in accordance with Accounting Standards Codification (“ASC”) Topic 480 “Distinguishing Liabilities from Equity.” In such case, the Company will proceed with a Business Combination if the Company has net tangible assets of at least $5,000,001 upon such consummation of a Business Combination and a majority of the shares voted are voted in favor of the Business Combination. If a shareholder vote is not required by law and the Company does not decide to hold a shareholder vote for business or other reasons, the Company will, pursuant to the amended and restated memorandum and articles of association which will be adopted by the Company upon the consummation of the Proposed Public Offering (the “Amended and Restated Memorandum and Articles of Association”), conduct the redemptions pursuant to the tender offer rules of the U.S. Securities and Exchange Commission (the “SEC”), and file tender offer documents with the SEC prior to completing a Business Combination. If, however, a shareholder approval of the transactions is required by law, or the Company decides to obtain shareholder approval for business or other reasons, the Company will offer to redeem shares in conjunction with a proxy solicitation pursuant to the proxy rules and not pursuant to the tender offer rules. Additionally, each Public Shareholder may elect to redeem their Public Shares irrespective of whether they vote for or against the proposed transaction. If the Company seeks shareholder approval in connection with a Business Combination, the holders of the Founder Shares prior to this Proposed Public Offering (the “Initial Shareholders”) have agreed to vote their Founder Shares (as defined in Note 5) and any Public Shares purchased during or after the Proposed Public Offering in favor of a Business Combination. In addition, the Initial Shareholders have agreed to waive their redemption rights with respect to their Founder Shares and Public Shares in connection with the completion of a Business Combination.
Notwithstanding the foregoing, the Company’s Amended and Restated Memorandum and Articles of Association will provide that a Public Shareholder, together with any affiliate of such shareholder or any other person with whom such shareholder is acting in concert or as a “group” (as defined under Section 13 of the Securities Exchange Act of 1934, as amended (the “Exchange Act”)), will be restricted from redeeming its shares with respect to more than an aggregate of 15% of the Class A ordinary shares sold in the Proposed Public Offering, without the prior consent of the Company.
The Company’s Sponsor, executive officers, directors and director nominees will have agreed not to propose an amendment to the Company’s Amended and Restated Memorandum and Articles of Association that would affect the substance or timing of the Company’s obligation to provide for the redemption of its Public Shares in connection with a Business Combination or to redeem 100 % of its Public Shares if the Company does not complete a Business Combination, unless the Company provides the Public Shareholders with the opportunity to redeem their Class A ordinary shares in conjunction with any such amendment.
If the Company is unable to complete a Business Combination within 24 months from the closing of the Proposed Public Offering, or 27 months from the closing of the Proposed Public Offering if the Company has executed a letter of intent, agreement in principle or definitive agreement for an initial Business Combination within 24 months from the closing of the Proposed Public Offering (as such period may be extended, the “Combination Period”), the Company will (i) cease all operations except for the purpose of winding up; (2) as promptly as reasonably possible but not more than 10 business days thereafter, redeem the Public Shares, at a 701,250 , and/or to pay our taxes (less up to $100,000 of interest to pay dissolution expenses and which interest shall be net of taxes payable), divided by the number of then issued and outstanding Public Shares, which redemption will completely extinguish Public Shareholders’ rights as shareholders (including the right to receive further liquidating distributions, if any); and (3) as promptly as reasonably possible following such redemption, subject to the approval of the remaining shareholders and the board of directors, liquidate and dissolve, subject in each case to the Company’s obligations under Cayman Islands law to provide for claims of creditors and the requirements of other applicable law.
per-share
price, payable in cash, equal to the aggregate amount then on deposit in the Trust Account, including interest earned on the funds held in the Trust Account and not previously released to the Company to fund its working capital requirements, subject to an annual limit of $F-8
The Initial Shareholders have agreed to waive their liquidation rights with respect to the Founder Shares if the Company fails to complete a Business Combination within the Combination Period. However, if the Initial Shareholders should acquire Public Shares in or after the Proposed Public Offering, they will be entitled to liquidating distributions from the Trust Account with respect to such Public Shares if the Company fails to complete a Business Combination within the Combination Period. The underwriters have agreed to waive their rights to their deferred underwriting commission (see Note 6) held in the Trust Account in the event the Company does not complete a Business Combination within the Combination Period and, in such event, such amounts will be included with the funds held in the Trust Account that will be available to fund the redemption of the Company’s Public Shares. In the event of such distribution, it is possible that the per share value of the residual assets remaining available for distribution (including Trust Account assets) will be only $10.00 per share initially held in the Trust Account. In order to protect the amounts held in the Trust Account, the Sponsor has agreed that it will be liable to the Company if and to the extent any claims by a third party for services rendered or products sold to the Company, or a prospective target business with which the Company has entered into a written letter of intent, confidentiality or other similar agreement or business combination agreement, reduce the amount of funds in the Trust Account to below the lesser of (i) $10.00 per Public Share and (ii) the actual amount per Public Share held in the Trust Account as of the date of the liquidation of the Trust Account, if less than $10.00 per share due to reductions in the value of the trust assets, less taxes payable, provided that such liability will not apply to any claims by a third party or prospective target business who executed a waiver of any and all rights to the monies held in the Trust Account (whether or not such waiver is enforceable) nor will it apply to any claims under the Company’s indemnity of the underwriters of the Proposed Public Offering against certain liabilities, including liabilities under the Securities Act of 1933, as amended (the “Securities Act”). In the event that an executed waiver is deemed to be unenforceable against a third party, the Sponsor will not be responsible to the extent of any liability for such third-party claims. The Company will seek to reduce the possibility that the Sponsor will have to indemnify the Trust Account due to claims of creditors by endeavoring to have vendors, service providers (except the Company’s independent registered public accounting firm), prospective target businesses or other entities with which the Company does business, execute agreements with the Company waiving any right, title, interest or claim of any kind in or to monies held in the Trust Account.
Basis of Presentation
The accompanying financial statements are presented in U.S. dollars in conformity with accounting principles generally accepted in the United States of America (“GAAP”) and pursuant to the rules and regulations of the SEC.
In connection with the Company’s assessment of going concern considerations in accordance with
ASU 2014-15,
“Disclosures of Uncertainties about an Entity’s Ability to Continue as a Going Concern,” as of December 31, 2020, the Company does not have sufficient liquidity to meet its current obligations. However, management has determined that the Company has access to funds from the Sponsor that are sufficient to fund the working capital needs of the Company until the earlier of the consummation of the Proposed Public Offering or a minimum one year from the date of issuance of these financial statements. Emerging Growth Company
The Company is an “emerging growth company,” as defined in Section 2(a) of the Securities Act, as modified by the Jumpstart Our Business Startups Act of 2012 (the “JOBS Act”), and it may take advantage of certain exemptions from various reporting requirements that are applicable to other public companies that are not emerging growth companies including, but not limited to, not being required to comply with the auditor attestation requirements of Section 404 of the Sarbanes-Oxley Act of 2002, reduced disclosure obligations regarding executive compensation in its periodic reports and proxy statements, and exemptions from the requirements of holding a nonbinding advisory vote on executive compensation and shareholder approval of any golden parachute payments not previously approved.
F-9
Further
, Section 102(b)(1) of the JOBS Act exempts emerging growth companies from being required to comply with new or revised financial accounting standards until private companies (that is, those that have not had a Securities Act registration statement declared effective or do not have a class of securities registered under the Exchange Act) are required to comply with the new or revised financial accounting standards. The JOBS Act provides that an emerging growth company can elect to opt out of the extended transition period and comply with the requirements that apply to non-emerging
growth companies but any such election to opt out is irrevocable. The Company has elected not to opt out of such extended transition period which means that when a standard is issued or revised and it has different application dates for public or private companies, the Company, as an emerging growth company, can adopt the new or revised standard at the time private companies adopt the new or revised standard. This may make comparison of the Company’s financial statements with another public company which is neither an emerging growth company nor an emerging growth company which has opted out of using the extended transition period difficult or impossible because of the potential differences in accounting standards used. Note 2. Summary of Significant Accounting Policies
Use of Estimates
The preparation of financial statements in conformity with GAAP requires the Company’s management to make estimates and assumptions that affect the reported amounts of assets and liabilities and disclosure of contingent assets and liabilities at the date of the financial statements and the reported amounts of expenses during the reporting period.
Making estimates requires management to exercise significant judgment. It is at least reasonably possible that the estimate of the effect of a condition, situation or set of circumstances that existed at the date of the financial statements, which management considered in formulating its estimate, could change in the near term due to one or more future confirming events. Accordingly, the actual results could differ significantly from those estimates.
Financial Instruments
The fair value of the Company’s assets and liabilities, which qualify as financial instruments under the FASB ASC 820, “Fair Value Measurements and Disclosures,” approximates the carrying amounts represented in the balance sheet, primarily due to their short-term nature.
Deferred Offering Costs
Deferred offering costs consist of legal fees incurred through the balance sheet date that are directly related to the Proposed Public Offering and that will be charged to shareholder’s equity upon the completion of the Proposed Public Offering. Should the Proposed Public Offering prove to be unsuccessful, these deferred costs, as well as additional expenses to be incurred, will be charged to operations.
Net Loss Per Ordinary Share
The Company complies with accounting and disclosure requirements of FASB ASC Topic 260, “Earnings Per Share.” Net loss per ordinary share is computed by dividing net loss by the weighted average number of ordinary shares outstanding during the period, excluding ordinary shares subject to forfeiture. Weighted average shares at December 31, 2020 were reduced for the effect of an aggregate of 3,187,500 Class B ordinary shares that are subject to forfeiture if the over-allotment option is not exercised in full or in part by the underwriters (see Note 6). At December 31, 2020, the Company did not have any dilutive securities and other contracts that could, potentially, be exercised or converted into ordinary shares and then share in the earnings of the Company. As a result, diluted loss per ordinary share is the same as basic loss per ordinary share for the period presented.
F-10
Income Taxes
The Company complies with the accounting and reporting requirements of ASC Topic 740, “Income Taxes,” which prescribes a recognition threshold and a measurement attribute for the financial statement recognition and measurement of tax positions taken or expected to be taken in a tax return. For those benefits to be recognized, a tax position must be no unrecognized tax benefits and no amounts accrued for interest and penalties as of December 31, 2020. The Company is currently not aware of any issues under review that could result in significant payments, accruals or material deviation from its position.
more-likely-than-not
to be sustained upon examination by taxing authorities. The Company’s management determined that the Cayman Islands is the Company’s only major tax jurisdiction. The Company recognizes accrued interest and penalties related to unrecognized tax benefits as income tax expense. There were There is currently no taxation imposed on income by the Government of the Cayman Islands. In accordance with Cayman federal income tax regulations, income taxes are not levied on the Company. Consequently, income taxes are not reflected in the Company’s financial statements. The Company’s management does not expect that the total amount of unrecognized tax benefits will materially change over the next twelve months.
Recent Accounting Standards
The Company’s management does not believe that any recently issued, but not yet effective, accounting standards updates, if currently adopted, would have a material effect on the accompanying financial statements.
Note 3. Proposed Public Offering
Pursuant to the Proposed Public Offering, the Company will offer for sale up to 85,000,000 Units (or 97,750,000 Units if the underwriters’ option to purchase additional units is exercised in full) at a purchase price of $10.00 per Unit. Each Unit will consist of one Class A ordinary share and one-eighth of one redeemable warrant (“Public Warrant”). Each whole Public Warrant will entitle the holder to purchase one Class A ordinary share at an exercise price of $11.50 per share, subject to adjustment (see Note 7).
Note 4. Private Placement
The Sponsor agreed to purchase an aggregate of 7,880,000 Private Placement Warrants (or 8,900,000 Private Placement Warrants if the underwriters’ over-allotment option is exercised in full), at a price of $2.50 per Private Placement Warrant ($19.7 million in the aggregate, or approximately $22.3 million if the underwriters’ over-allotment option is exercised in full) in the Private Placement that will occur simultaneously with the closing of the Proposed Public Offering.
Each whole Private Placement Warrant is exercisable for one whole Class A ordinary share at a price of $11.50 per share. A portion of the proceeds from the sale of the Private Placement Warrants to the Sponsor will be added to the proceeds from the Proposed Public Offering to be held in the Trust Account. If the Company does not complete a Business Combination within the Combination Period, the Private Placement Warrants will expire worthless. The Private Placement Warrants will be
non-redeemable
for cash and exercisable on a cashless basis, except as described in Note 7, so long as they are held by the Sponsor or its permitted transferees. The Sponsor and the Company’s officers and directors will agree, subject to limited exceptions, not to transfer, assign or sell any of their Private Placement Warrants until 30 days after the completion of the initial Business Combination.
F-11
Note 5. Related Party Transactions
Founder Shares
On October 7, 2020, the Sponsor paid an aggregate of $25,000 to cover for certain expenses on behalf of the Company in exchange for issuance of 2,875,000 ordinary shares (the “Founder Shares”). On February 10, 2021, the Company effected a share capitalization resulting in an aggregate of 24,437,500 Founder Shares outstanding. All shares and the associated amounts in the accompanying financial statements and notes thereto have been retroactively restated to reflect the share capitalization. The Sponsor has agreed to forfeit up to an aggregate of 3,187,500 Founder Shares, on a pro rata basis, to the extent that the option to purchase additional units is not exercised in full by the underwriters. The forfeiture will be adjusted to the extent that the option to purchase additional units is not exercised in full by the underwriters so that the Founder Shares will represent 20 % of the Company’s issued and outstanding shares after the Proposed Public Offering. If the Company increases or decreases the size of the Proposed Public Offering, the Company will effect a share capitalization or a share repurchase or redemption or other appropriate mechanism, as applicable, with respect to the Class B ordinary shares prior to the consummation of the Proposed Public Offering in such amount as to maintain the number of Founder Shares at 20 % of the Company’s issued and outstanding ordinary shares upon the consummation of the Proposed Public Offering. Subsequent to the share capitalization, on February 10, 2021, the Sponsor transferred 30,000 Founder Shares to each of the Company’s independent director nominees
.
The Initial Shareholders have agreed not to transfer, assign or sell any of their Founder Shares until the earlier to occur of (1) one year after the completion of the initial Business Combination; and (2) subsequent to the initial Business Combination (x) if the last reported sale price of Class A ordinary shares equals or exceeds $12.00 per share (as adjusted for share 20 trading days within any
30 -trading day period commencing at least 150 days after the initial Business Combination or (y) the date on which the Company completes a liquidation, merger, share exchange, reorganization or other similar transaction that results in all of the Public Shareholders having the right to exchange their ordinary shares for cash, securities or other property.
sub-divisions,
share dividends, rights issuances, consolidations, reorganizations, recapitalizations and other similar transactions) for any Related Party Loans
On October 7, 2020, the Sponsor agreed to loan the Company up to $300,000 to be used for the payment of costs related to the Proposed Public Offering pursuant to a promissory note (the “Note”). The Note is
non-interest
bearing, unsecured and due on the earlier of December 31, 2021 and the closing of the Proposed Public Offering. The Company intends to repay the Note from the proceeds of the Proposed Public Offering and the sale of the Private Placement Warrants not being placed in the Trust Account. As of December 31, 2020, the Company has not borrowed any amount under the Note. In addition, in order to finance transaction costs in connection with a Business Combination, the Sponsor, members of the Company’s founding team or any of their affiliates may, but are not obligated to, loan the Company funds as may be required (“Working Capital Loans”). If the Company completes a Business Combination, the Company would repay the Working Capital Loans out of the proceeds of the Trust Account released to the Company. Otherwise, the Working Capital Loans would be repaid only out of funds held outside the Trust Account. In the event that a Business Combination does not close, the Company may use a portion of proceeds held outside the Trust Account to repay the Working Capital Loans but no proceeds held in the Trust Account would be used to repay the Working Capital Loans. The Working Capital Loans would either be repaid upon consummation of a Business Combination, without interest, or, at the lender’s discretion, up to $2.5 million of such Working Capital Loans may be convertible into warrants of the post Business Combination entity at a price of $2.50 per warrant. The warrants would be identical to the Private Placement Warrants. Except for the foregoing, the terms of such Working Capital Loans, if any, have not been determined and no written agreements exist with respect to such loans. As of December 31, 2020, the Company had no borrowings under the Working Capital Loans.
F-12
Support Services Agreement
The Company will enter into a support services agreement (the “Support Services Agreement”) that will provide that, commencing on the date that the Company’s securities are first listed on Nasdaq through the earlier of consummation of the initial Business Combination and its liquidation, the Company will pay $1,875,000 Support Services Fees to Reinvent Capital LLC per year for support and administrative services.
In addition, the Sponsor, officers and directors, or any of their respective affiliates will be reimbursed for any expenses incurred in connection with activities on the Company’s behalf such as identifying potential target businesses and performing due diligence on suitable Business Combinations. The Company’s audit committee will review on a quarterly basis all payments that were made to the Sponsor, officers or directors, or the Company’s or their affiliates. Any such payments prior to an initial Business Combination will be made from funds held outside the Trust Account, including funds released from the Trust Account to pay for working capital, subject to an annual limit of $701,250 .
out-of-pocket
Note 6. Commitments and Contingencies
Registration Rights
The holders of the Founder Shares, Private Placement Warrants and any warrants that may be issued upon conversion of Working Capital Loans (and any Class A ordinary shares issuable upon the exercise of the Private Placement Warrants or warrants issued upon conversion of the Working Capital Loans and upon conversion of the Founder Shares) will be entitled to registration rights pursuant to a registration rights agreement to be signed prior to or on the effective date of the Proposed Public Offering. The holders of these securities are entitled to make up to three demands, excluding short form demands, that the Company registers such securities. In addition, the holders have certain “piggy-back” registration rights with respect to registration statements filed subsequent to the completion of the initial Business Combination. The Company will bear the expenses incurred in connection with the filing of any such registration statements.
Underwriting Agreement
The Company will grant the underwriters a 12,750,000 additional Units at the Proposed Public Offering price less the underwriting discounts and commissions.
45-day
option from the date of this prospectus to purchase up to Risks and Uncertainties
Management continues to evaluate the impact of the COVID-19 pandemic on the industry and has concluded that while it is reasonably possible that the virus could have a negative effect on the Company’s financial position, results of its operations, close of the Proposed Public Offering, and/or search for a target company, the specific impact is not readily determinable as of the date of these financial statements. The financial statements do not include any adjustments that might result from the outcome of this uncertainty.
Note 7. Shareholder’s Equity
Class
A Ordinary Shares
F-13
Class
B Ordinary Shares
Class A ordinary shareholders and Class B ordinary shareholders of record are entitled to one vote
The Class B ordinary shares will automatically convert into Class A ordinary shares at the time of the initial Business Combination, or earlier at the option of the holder, on a basis, subject to adjustment for share 20 % of the sum of all ordinary shares issued and outstanding upon the completion of the Proposed Public Offering plus all Class A ordinary shares and equity-linked securities issued or deemed issued in connection with the initial Business Combination, excluding any shares or equity-linked securities issued, or to be issued, to any seller in the initial Business Combination. In no event will the Class B ordinary shares convert into Class A ordinary shares at a rate of less than one to one.
one-for-one
sub-divisions,
share dividends, rights issuances, consolidations, reorganizations, recapitalizations and the like, and subject to further adjustment. In the case that additional Class A ordinary shares, or equity-linked securities, are issued or deemed issued in excess of the amounts issued in the Proposed Public Offering and related to the closing of the initial Business Combination, the ratio at which the Class B ordinary shares will convert into Class A ordinary shares will be adjusted (unless the holders of a majority of the issued and outstanding Class B ordinary shares agree to waive such anti-dilution adjustment with respect to any such issuance or deemed issuance) so that the number of Class A ordinary shares issuable upon conversion of all Class B ordinary shares will equal, in the aggregate, on an as-converted
basis, Preference Shares
Warrants
F-14
may, at its option, requires holders of Public Warrants who exercise their warrants to do so on a “cashless basis” in accordance with Section 3(a)(9) of the Securities Act and, in the event the Company so elects, it will not be required to file or maintain in effect a registration statement.
T
he warrants have an exercise price of $11.50 per share, subject to adjustments, and will expire five years after the completion of a Business Combination or earlier upon redemption or liquidation. In addition, if (x) the Company issues additional ordinary shares or equity-linked securities for capital raising purposes in connection with the closing of the initial Business Combination at an issue price or effective issue price of less than $9.20 per ordinary share (with such issue price or effective issue price to be determined in good faith by the board of directors and, in the case of any such issuance to the Sponsor or its affiliates, without taking into account any Founder Shares held by the Sponsor or such affiliates, as applicable, prior to such issuance) (the “Newly Issued Price”), (y) the aggregate gross proceeds from such issuances represent more than 60 % of the total equity proceeds, and interest thereon, available for the funding of the initial Business Combination on the date of the completion of the initial Business Combination (net of redemptions), and (z) the volume weighted average trading price of the Class A ordinary shares during the 20 trading day period starting on the trading day prior to the day on which the Company consummates its initial business Combination (such price, the “Market Value”) is below $9.20 per share, the exercise price of the warrants will be adjusted (to the nearest cent) to be equal to 115 % of the higher of the Market Value and the Newly Issued Price, the $18.00 per share redemption trigger price described below under “Redemption of warrants when the price per Class A ordinary share equals or exceeds $18.00” and “Redemption of warrants when the price per Class A ordinary share equals or exceeds $10.00” will be adjusted (to the nearest cent) to be equal to 180 % of the higher of the Market Value and the Newly Issued Price, and the $10.00 per share redemption trigger price described below under “Redemption of warrants when the price per Class A ordinary share equals or exceeds $10.00” will be adjusted (to the nearest cent) to be equal to the higher of the Market Value and the Newly Issued Price.
The Private Placement Warrants are identical to the Public Warrants underlying the Units sold in the Proposed Public Offering, except that the Private Placement Warrants and the Class A ordinary shares issuable upon exercise of the Private Placement Warrants will not be transferable, assignable or salable until 30 days after the completion of a Business Combination, subject to certain limited exceptions. Additionally, the Private Placement Warrants will be
non-redeemable,
except as described below, so long as they are held by the initial purchasers or such purchasers’ permitted transferees. If the Private Placement Warrants are held by someone other than the Initial Shareholders or their permitted transferees, the Private Placement Warrants will be redeemable by the Company and exercisable by such holders on the same basis as the Public Warrants. Redemption of Warrants When the Price Per Class A Ordinary Share Equals or Exceeds $18.00:
Once the warrants become exercisable, the Company may redeem the outstanding warrants (except as described herein with respect to the Private Placement Warrants):
| • | in whole and not in part; |
| • | at a price of $ |
| • | upon not less than |
| • | if, and only if, the last reported sale price of Class A ordinary shares for any |
The Company will not redeem the warrants as described above unless a registration statement under the Securities Act covering the issuance of the Class A ordinary shares issuable upon exercise of the warrants is then effective and a current prospectus relating to those Class A ordinary shares is available throughout the
30-day
redemption period. If and when the warrants become redeemable by the Company, it may exercise its redemption right even if the Company is unable to register or qualify the underlying securities for sale under all applicable state securities laws. F-15
Redemption of Warrants When the Price Per Class A Ordinary Share Equals or Exceeds $10.00:
Once the warrants become exercisable, the Company may redeem the outstanding warrants (except as described herein with respect to the Private Placement Warrants):
| • | in whole and not in part; |
| • | at $ |
| • | if, and only if, the Reference Value equals or exceeds $ |
| • | if the Reference Value is less than $ |
The “fair market value” of Class A ordinary shares shall mean the volume-weighted average price of Class A ordinary shares for the 10 trading days following the date on which the notice of redemption is sent to the holders of warrants. In no event will the warrants be exercisable in connection with this redemption feature for more than 0.361 Class A ordinary shares per warrant (subject to adjustment).
In no event will the Company be required to net cash settle any warrant. If the Company is unable to complete a Business Combination within the Combination Period and the Company liquidates the funds held in the Trust Account, holders of warrants will not receive any of such funds with respect to their warrants, nor will they receive any distribution from the Company’s assets held outside of the Trust Account with the respect to such warrants. Accordingly, the warrants may expire worthless.
Note 8. Subsequent Events
On February 10, 2021, the Company effected a share capitalization resulting in an aggregate of 24,437,500 Class B ordinary shares outstanding. All shares and the associated amounts in the accompanying financial statements and notes thereto have been retroactively restated to reflect the share capitalization. Subsequent to the share capitalization, on February 10, 2021, the Sponsor transferred 30,000 Founder Shares to each of the Company’s independent director nominees. In addit122,000 under the Note.
i
on, subsequent to December 31, 2020, the Company borrowed approximately $The Company has evaluated subsequent events to determine if events or transactions occurring after the balance sheet date through February 12, 2021, the date the financial statements were available to be issued, require potential adjustment to or disclosure in the financial statements and has concluded that, there were no such events that would require recognition or disclosure other than disclosed above.
F-16
REINVENT TECHNOLOGY PARTNERS Y
CONDENSED CONSOLIDATED BALANCE SHEETS
June 30, 2021 |
December 31, 2020 |
|||||||
Assets: |
(unaudited) | |||||||
| Current assets: |
||||||||
| Cash |
$ | $ | — | |||||
| Prepaid expenses |
||||||||
| |
|
|
|
|||||
| Total current assets |
||||||||
| Deferred offering costs associated with proposed public offering |
— | |||||||
| Investment held in Trust Account |
— | |||||||
| |
|
|
|
|||||
| Total Assets |
$ |
$ |
||||||
| |
|
|
|
|||||
| Liabilities and Shareholders’ Equity: |
||||||||
| Current liabilities: |
||||||||
| Accounts payable |
$ | $ | ||||||
| Accrued expenses |
||||||||
| Due to related party |
— | |||||||
| |
|
|
|
|||||
| Total current liabilities |
||||||||
| Deferred legal fees |
— | |||||||
| Deferred underwriting commissions |
— | |||||||
| Derivative warrant liabilities |
— | |||||||
| |
|
|
|
|||||
| Total liabilities |
||||||||
| Commitments and Contingencies |
|
|
||||||
| Class A ordinary shares, $ June 30 , 2021 and December 31, 2020, respectively |
— | |||||||
| Shareholders’ Equity: |
||||||||
| Preference shares, $ |
|
— | ||||||
| Class A ordinary shares, $
and shares subject to possible redemption) at
June 30 , 2021 and December 31, 2020, respectively |
— | |||||||
| Class B ordinary shares, $ June 30 , 2021 and December 31, 2020 |
||||||||
| Additional paid-in capital |
||||||||
| Accumulated deficit |
( |
) | ( |
) | ||||
| |
|
|
|
|||||
| Total shareholders’ equity |
||||||||
| |
|
|
|
|||||
| Total Liabilities and Shareholders’ Equity |
$ |
$ |
||||||
| |
|
|
|
|||||
The accompanying notes are an integral part of these unaudited condensed consolidated financial statements.
F-17
REINVENT TECHNOLOGY PARTNERS Y
UNAUDITED CONDENSED CONSOLIDATED STATEMENTS OF OPERATIONS
FOR THE THREE AND SIX MONTHS ENDED JUNE 30, 2021
For the three months ended June 30, 2021 |
For the six months ended June 30, 2021 |
|||||||
| General and administrative expenses |
$ | |
$ |
|||||
| |
|
|
|
|||||
| Loss from operations |
( |
) | |
|
( |
) | ||
| Other income (expense) |
|
|
|
|||||
| Change in fair value of derivative warrant liabilities |
( |
) | |
|
( |
) | ||
| Financing costs - derivative warrant liabilities |
|
|
( |
) | ||||
| Unrealized gain on investments held in Trust Account |
|
|
|
|||||
| |
|
|
|
|||||
| Total other income (expense) |
( |
) | |
|
( |
) | ||
| |
|
|
|
|||||
| Net loss |
$ | ( |
) | |
$ |
( |
) | |
| |
|
|
|
|||||
| Basic and diluted weighted average shares outstanding of Class A ordinary shares |
|
|
|
|||||
| |
|
|
|
|||||
| Basic and diluted net loss per ordinary share |
$ |
|
|
$ |
|
|||
| |
|
|
|
|||||
| Basic and diluted weighted average shares outstanding of Class B ordinary shares |
|
|
|
|||||
| |
|
|
|
|||||
| Basic and diluted net loss per ordinary share |
$ | ( |
) | |
$ |
( |
) | |
| |
|
|
|
|||||
The accompanying notes are an integral part of these unaudited condensed consolidated financial statements.
F-18
REINVENT TECHNOLOGY PARTNERS Y
UNAUDITED CONDENSED CONSOLIDATED STATEMENTS OF CHANGES IN SHAREHOLDERS’ EQUITY
FOR THE THREE AND SIX MONTHS ENDED JUNE 30, 2021
Ordinary Shares |
Additional Paid-in Capital |
Accumulated Deficit |
Total Shareholders’ Equity |
|||||||||||||||||||||||||
Class A |
Class B |
|||||||||||||||||||||||||||
Shares |
Amount |
Shares |
Amount |
|||||||||||||||||||||||||
| Balance - December 31, 2020 |
$ |
$ |
$ |
$ |
( |
) |
$ |
|||||||||||||||||||||
| Sale of units in initial public offering, less allocation to derivative warrant liabilities |
— |
— |
— |
|||||||||||||||||||||||||
| Offering costs |
— |
— |
— |
— |
( |
) |
— |
( |
) | |||||||||||||||||||
| Excess of cash receipts over the fair value of the private warrants sold to Sponsor |
— |
— |
— |
— |
— |
|||||||||||||||||||||||
| Shares subject to possible redemption |
( |
) |
( |
) |
— |
— |
( |
) |
— |
( |
) | |||||||||||||||||
| Net loss |
— |
— |
— |
— |
— |
( |
) |
( |
) | |||||||||||||||||||
| |
|
|
|
|
|
|
|
|
|
|
|
|
|
|||||||||||||||
| Balance - March 31, 2021 (unaudited) |
$ |
$ |
$ |
$ |
( |
) |
$ |
|||||||||||||||||||||
| Shares subject to possible redemption |
— |
— |
— |
|||||||||||||||||||||||||
| Net loss |
— |
— |
— |
— |
— |
( |
) |
( |
) | |||||||||||||||||||
| |
|
|
|
|
|
|
|
|
|
|
|
|
|
|||||||||||||||
| Balance - June 30, 2021 (unaudited) |
$ |
$ |
$ |
$ |
( |
) |
$ |
|||||||||||||||||||||
| |
|
|
|
|
|
|
|
|
|
|
|
|
|
|||||||||||||||
The accompanying notes are an integral part of these unaudited condensed consolidated financial statements.
F-19
REINVENT TECHNOLOGY PARTNERS Y
UNAUDITED CONDENSED CONSOLIDATED STATEMENT OF CASH FLOWS
FOR THE SIX MONTHS ENDED JUNE 30, 2021
| Cash Flows from Operating Activities: |
||||
| Net loss |
$ | ( |
) | |
| Change in fair value of derivative warrant liabilities |
||||
| Financing costs - derivative warrant liabilities |
||||
| Unrealized gain on investments held in Trust Account |
( |
) | ||
| Changes in operating assets and liabilities: |
||||
| Prepaid expenses |
( |
) | ||
| Accounts payable |
||||
| Accrued expenses |
||||
| Due to related party |
||||
| |
|
|||
| Net cash used in operating activities |
( |
) | ||
| |
|
|||
| Cash Flows from Investing Activities: |
||||
| Cash deposited in Trust Account |
( |
) | ||
| |
|
|||
| Net cash used in investing activities |
( |
) | ||
| |
|
|||
| Cash Flows from Financing Activities: |
||||
| Repayment of note payable to related party |
( |
) | ||
| Proceeds received from initial public offering, gross |
||||
| Proceeds received from private placement |
||||
| Offering costs paid |
( |
) | ||
| |
|
|||
| Net cash provided by financing activities |
||||
| |
|
|||
| Net increase in cash |
||||
| Cash - beginning of the period |
|
|||
| |
|
|||
| Cash - end of the period |
$ |
|||
| |
|
|||
| Supplemental disclosure of noncash investing and financing activities: |
||||
| Offering costs included in accrued expenses |
$ | |||
| Offering costs paid by related party under promissory note |
$ | |||
| Deferred legal fees |
$ | |||
| Deferred underwriting commissions |
$ | |||
| Initial value of Class A ordinary shares subject to possible redemption |
$ | |||
| Change in value of Class A ordinary shares subject to possible redemption |
$ | ( |
) | |
The accompanying notes are an integral part of these unaudited condensed consolidated financial statements.
F-20
REINVENT TECHNOLOGY PARTNERS Y
NOTES TO UNAUDITED CONDENSED CONSOLIDATED FINANCIAL STATEMENTS
Note 1—Description of Organization, Business Operations and Basis of Presentation
Reinvent Technology Partners Y, formerly known as Reinvent Technology Partners C (the “Company”), is a blank check company incorporated as a Cayman Islands exempted company on October 2, 2020 .
On June 21, 2021, RTPY Merger Sub Inc. (“Merger Sub”), a Delaware corporation and a direct wholly-owned subsidiary of the Company, was formed. The Company was incorporated for the purpose of effecting a merger, share exchange, asset acquisition, share purchase, reorganization or similar business combination with one or more businesses (a “Business Combination”).
All activity for the period from October 2, 2020 (inception) through June 30, 2021 relates to the Company’s formation and the initial public offering (the “Initial Public Offering”), which is described below, and, subsequent to the Initial Public Offering, the search for a target company for a Business Combination. The Company has selected December 31 as its fiscal year end. The Company will not generate any operating revenues until after the completion of its initial Business Combination, at the earliest. The Company will generate
non-operating
income in the form of interest income on cash and cash equivalents from the net proceeds derived from the Initial Public Offering and Private Placement (defined below). The Company’s sponsor is Reinvent Sponsor Y LLC, a Cayman Islands limited liability company (the “Sponsor”). The registration statement for the Company’s Initial Public Offering was declared effective on March 15, 2021. On March 18, 2021, the Company consummated its Initial Public Offering of 97,750,000 units (the “Units” and, with respect to the Class A ordinary shares included in the Units, the “Public Shares”), including 12,750,000 additional Units to cover over-allotments (the “Over-Allotment Units”), at $10.00 per Unit, generating gross proceeds of $977.5 million, and incurring offering costs of approximately $54.5 million, of which approximately $34.2 million and approximately $18,000 was for deferred underwriting commissions and deferred legal fees, respectively (see Note 6).
Substantially concurrently with the closing of the Initial Public Offering, the Company consummated the private placement (the “Private Placement”) of
8,900,000 warrants (each, a “Private Placement Warrant” and collectively, the “Private Placement Warrants”), at a price of $2.50 per Private Placement Warrant to the Sponsor, generating gross proceeds of approximately $22.3 million (see Note 4).
Upon the closing of the Initial Public Offering and the Private Placement, $977.5 million ($10.00 per Unit) of the net proceeds of the Initial Public Offering and certain of the proceeds of the Private Placement were placed in a trust account (“Trust Account”) with Continental Stock Transfer & Trust Company acting as trustee and invested in United States government treasury bills with a maturity of 185 days or less or in money market funds investing solely in U.S. Treasuries and meeting certain conditions under
Rule 2a-7 under
the Investment Company Act of 1940, as amended, or the Investment Company Act, as determined by the Company, until the earlier of: (i) the completion of a Business Combination and (ii) the distribution of the Trust Account as described below. The Company’s management has broad discretion with respect to the specific application of the net proceeds of its Initial Public Offering and the sale of Private Placement Warrants, although substantially all of the net proceeds are intended to be applied generally toward consummating a Business Combination. The Company’s initial Business Combination must be with one or more operating businesses or assets with a fair market value equal to at least 80 % of the net assets held in the Trust Account (net of amounts disbursed to management for working capital purposes, if permitted, and excluding the amount of any deferred underwriting discount held in Trust) at the time the Company signs a definitive agreement in connection with the initial Business Combination. However, the Company will only complete a Business Combination if the post-transaction company owns or acquires 50 % or more of the outstanding voting securities of the target or otherwise acquires a controlling interest in the target sufficient for it not to be required to register as an investment company under the Investment Company Act.
F-21
The Company will provide its holders of Public Shares (the “Public Shareholders”) with the opportunity to redeem all or a portion of their Public Shares upon the completion of a Business Combination either (i) in connection with a general meeting called to approve the Business Combination or (ii) by means of a tender offer. The decision as to whether the Company will seek shareholder approval of a Business Combination or conduct a tender offer will be made by the Company. The Public Shareholders will be entitled to redeem their Public Shares for a pro rata portion of the amount then in the Trust Account. The
per-share
amount to be distributed to Public Shareholders who redeem their Public Shares will not be reduced by the deferred underwriting commissions the Company will pay to the underwriters (as discussed in Note 6). These Public Shares are recorded at a redemption value and classified as temporary equity upon and following the completion of the Initial Public Offering, in accordance with the Financial Accounting Standards Board’s (“FASB”) Accounting Standards Codification (“ASC”) Topic 480 “Distinguishing Liabilities from Equity” (“ASC 480”). In such case, the Company will proceed with a Business Combination if the Company has net tangible assets of at least $
upon such consummation of a Business Combination and a majority of the shares voted are voted in favor of the Business Combination. If a shareholder vote is not required by law and the Company does not decide to hold a shareholder vote for business or other reasons, the Company will, pursuant to the amended and restated memorandum and articles of association which were adopted by the Company upon the consummation of the Initial Public Offering (the “Amended and Restated Memorandum and Articles of Association”), conduct the redemptions pursuant to the tender offer rules of the U.S. Securities and Exchange Commission (the “SEC”), and file tender offer documents with the SEC prior to completing a Business Combination. If, however, a shareholder approval of the transactions is required by law, or the Company decides to obtain shareholder approval for business or other reasons, the Company will offer to redeem shares in conjunction with a proxy solicitation pursuant to the proxy rules and not pursuant to the tender offer rules. Additionally, each Public Shareholder may elect to redeem their Public Shares irrespective of whether they vote for or against the proposed transaction. If the Company seeks shareholder approval in connection with a Business Combination, the holders of the Founder Shares (as defined in Note 5) prior to the Initial Public Offering (the “Initial Shareholders”) have agreed to vote their Founder Shares and any Public Shares purchased by them during or after the Initial Public Offering in favor of a Business Combination. In addition, the Initial Shareholders have agreed to waive their redemption rights with respect to their Founder Shares and Public Shares in connection with the completion of a Business Combination.
Notwithstanding the foregoing, the Company’s Amended and Restated Memorandum and Articles of Association provides that a Public Shareholder, together with any affiliate of such shareholder or any other person with whom such shareholder is acting in concert or as a “group” (as defined under Section 13 of the Securities Exchange Act of 1934, as amended (the “Exchange Act”)), will be restricted from redeeming its shares with respect to more than an aggregate of 15% of the Class A ordinary shares sold in the Initial Public Offering, without the prior consent of the Company.
The Sponsor and the Company’s executive officers and directors have agreed not to propose an amendment to the Company’s Amended and Restated Memorandum and Articles of Association that would affect the substance or timing of the Company’s obligation to provide for the redemption of its Public Shares in connection with a Business Combination or to redeem
% of its Public Shares if the Company does not complete a Business Combination, unless the Company provides the Public Shareholders with the opportunity to redeem their Class A ordinary shares in conjunction with any such amendment.
If the Company is unable to complete a Business Combination within 24 months from the closing of the Initial Public Offering, or 27 months from the closing of the Initial Public Offering if the Company has executed a letter of intent, agreement in principle or definitive agreement for an initial Business Combination within 24 months from the closing of the Initial Public Offering (as such period may be extended, the “Combination Period”), the Company will (i) cease all operations except for the purpose of winding up; (2) as promptly as reasonably
F-22 |
possible but not more than 10 business days thereafter, redeem the Public Shares, at a
per-share
price, payable in cash, equal to the aggregate amount then on deposit in the Trust Account, including interest earned on the funds held in the Trust Account and not previously released to the Company to fund its working capital requirements, subject to an annual limit of $701,250 , and/or to pay its taxes (less up to $100,000 of interest to pay dissolution expenses and which interest shall be net of taxes payable), divided by the number of then issued and outstanding Public Shares, which redemption will completely extinguish Public Shareholders’ rights as shareholders (including the right to receive further liquidating distributions, if any); and (3) as promptly as reasonably possible following such redemption, subject to the approval of the remaining shareholders and the board of directors, liquidate and dissolve, subject in each case to the Company’s obligations under Cayman Islands law to provide for claims of creditors and the requirements of other applicable law.
The Initial Shareholders agreed to waive their liquidation rights with respect to the Founder Shares if the Company fails to complete a Business Combination within the Combination Period. However, if the Initial Shareholders should acquire Public Shares in or after the Initial Public Offering, they will be entitled to liquidating distributions from the Trust Account with respect to such Public Shares if the Company fails to complete a Business Combination within the Combination Period. The underwriters have agreed to waive their rights to their deferred underwriting commission (see Note 6) held in the Trust Account in the event the Company does not complete a Business Combination within the Combination Period and, in such event, such amounts will be included with the funds held in the Trust Account that will be available to fund the redemption of the Company’s Public Shares. In the event of such distribution, it is possible that the per share value of the residual assets remaining available for distribution (including Trust Account assets) will be only $10.00 per share initially held in the Trust Account. In order to protect the amounts held in the Trust Account, the Sponsor has agreed that it will be liable to the Company if and to the extent any claims by a third party for services rendered or products sold to the Company, or a prospective target business with which the Company has entered into a written letter of intent, confidentiality or other similar agreement or business combination agreement, reduce the amount of funds in the Trust Account to below the lesser of (i) $10.00 per Public Share and (ii) the actual amount per Public Share held in the Trust Account as of the date of the liquidation of the Trust Account, if less than $10.00 per share due to reductions in the value of the trust assets, less taxes payable, provided that such liability will not apply to any claims by a third party or prospective target business who executed a waiver of any and all rights to the monies held in the Trust Account (whether or not such waiver is enforceable) nor will it apply to any claims under the Company’s indemnity of the underwriters of the Initial Public Offering against certain liabilities, including liabilities under the Securities Act of 1933, as amended (the “Securities Act”). In the event that an executed waiver is deemed to be unenforceable against a third party, the Sponsor will not be responsible to the extent of any liability for such third-party claims. The Company will seek to reduce the possibility that the Sponsor will have to indemnify the Trust Account due to claims of creditors by endeavoring to have vendors, service providers (except the Company’s independent registered public accounting firm), prospective target businesses or other entities with which the Company does business, execute agreements with the Company waiving any right, title, interest or claim of any kind in or to monies held in the Trust Account.
Note 2—Summary of Significant Accounting Policies
Basis of Presentation
The accompanying unaudited condensed consolidated financial statements are presented in U.S. dollars in conformity with accounting principles generally accepted in the United States of America (“U.S. GAAP”) and pursuant to the rules and regulations of the SEC. Accordingly, they do not include all of the information and footnotes required by U.S. GAAP. In the opinion of management, the unaudited condensed consolidated financial statements reflect all adjustments, which include only normal recurring adjustments necessary for the
F-23 |
fair statement of the balances and results for the periods presented. Operating results for the three and six months ended June 30, 2021 are not necessarily indicative of the results that may be expected through December 31, 2021 or for any future period.
Emerging Growth Company
The Company is an “emerging growth company,” as defined in Section 2(a) of the Securities Act, as modified by the Jumpstart Our Business Startups Act of 2012 (the “JOBS Act”), and it may take advantage of certain exemptions from various reporting requirements that are applicable to other public companies that are not emerging growth companies including, but not limited to, not being required to comply with the independent registered public accounting firm attestation requirements of Section 404 of the Sarbanes-Oxley Act of 2002, reduced disclosure obligations regarding executive compensation in its periodic reports and proxy statements, and exemptions from the requirements of holding a nonbinding advisory vote on executive compensation and shareholder approval of any golden parachute payments not previously approved.
Further, Section 102(b)(1) of the JOBS Act exempts emerging growth companies from being required to comply with new or revised financial accounting standards until private companies (that is, those that have not had a Securities Act registration statement declared effective or do not have a class of securities registered under the Exchange Act) are required to comply with the new or revised financial accounting standards. The JOBS Act provides that an emerging growth company can elect to opt out of the extended transition period and comply with the requirements that apply to
non-emerging
growth companies but any such an election to opt out is irrevocable. The Company has elected not to opt out of such extended transition period, which means that when a standard is issued or revised and it has different application dates for public or private companies, the Company, as an emerging growth company, can adopt the new or revised standard at the time private companies adopt the new or revised standard. This may make comparison of the Company’s condensed consolidated financial statements with another public company that is neither an emerging growth company nor an emerging growth company that has opted out of using the extended transition period difficult or impossible because of the potential differences in accounting standards used.
Liquidity and Capital Resources
As of June 30, 2021, the Company had approximately $501,500 in its operating bank account and working capital of approximately $977,000 .
The Company’s liquidity needs to date have been satisfied through a contribution of $25,000 from the Sponsor to cover certain expenses in exchange for the issuance of the Founder Shares, a loan of
$Based on the foregoing, management believes that the Company will have sufficient working capital and borrowing capacity from the Sponsor or an affiliate of the Sponsor, or certain of the Company’s officers and directors to meet its needs through the earlier of the consummation of a Business Combination and one year from this filing. Over this time period, the Company will be using these funds for paying existing accounts payable,
F-24 |
identifying and evaluating prospective initial Business Combination candidates, performing due diligence on prospective target businesses, paying for travel expenditures, selecting the target business to merge with or acquire, and structuring, negotiating and consummating the Business Combination.
Risks and Uncertainties
Management continues to evaluate the impact of the
COVID-19
pandemic on the industry and has concluded that while it is reasonably possible that the virus could have a negative effect on the Company’s financial position, results of its operations, and/or search for a target company, the specific impact is not readily determinable as of the date of this financial statement. The financial statement does not include any adjustments that might result from the outcome of this uncertainty. Concentration of Credit Risk
Financial instruments that potentially subject the Company to concentrations of credit risk consist of cash accounts in a financial institution, which, at times, may exceed the Federal Depository Insurance Corporation coverage limit of $250,000
Cash and Cash Equivalents
The Company considers all short-term investments with an original maturity of three months or less when purchased to be cash equivalents. The Company had no
Investments Held in Trust Account
The Company’s portfolio of investments is comprised of U.S. government securities, within the meaning s185 days or less, or investments in money market funds that invest in U.S. government securities and generally have a readily determinable fair value, or a combination thereof. When the Company’s investments held in the Trust Account are comprised of U.S. government securities, the investments are classified as trading securities. When the Company’s investments held in the Trust Account are comprised of money market funds, the investments are recognized at fair value. Trading securities and investments in money market funds are presented on the condensed consolidated balance sheets at fair value at the end of each reporting period. Gains and losses resulting from the change in fair value of these securities is included in unrealized gain on investments held in Trust Account in the accompanying unaudited condensed consolidated statements of operations. The estimated fair values of investments held in the Trust Account are determined using available market information.
e
t forth in Section 2(a)(16) of the Investment Company Act, with a maturity of Use of Estimates
The preparation of condensed consolidated financial statements in conformity with U.S. GAAP requires the Company’s management to make estimates and assumptions that affect the reported amounts of assets and liabilities and disclosure of contingent assets and liabilities at the date of the condensed consolidated financial statements and the reported amounts of expenses during the reporting period. Making estimates requires management to exercise significant judgment. It is at least reasonably possible that the estimate of the effect of a condition, situation or set of circumstances that existed at the date of the condensed consolidated financial statements, which management considered in formulating its estimate, could change in the near term due to one
F-25 |
or more future confirming events. One of the more significant accounting estimates included in these condensed consolidated financial statements is the determination of the fair value of the warrant liability. Such estimates may be subject to change as more current information becomes available and accordingly the actual results could differ significantly from those estimates.
Fair Value of Financial Instruments
The fair value of the Company’s assets and liabilities, which qualify as financial instruments under the FASB ASC Topic 820, “Fair Value Measurements,” approximates the carrying amounts represented in the condensed consolidated balance sheets.
Fair Value Measurements
Fair value is defined as the price that would be received for sale of an asset or paid for transfer of a liability, in an orderly transaction between market participants at the measurement date. U.S. GAAP establishes a three-tier fair value hierarchy, which prioritizes the inputs used in measuring fair value.
The hierarchy gives the highest priority to unadjusted quoted prices in active markets for identical assets or liabilities (Level 1 measurements) and the lowest priority to unobservable inputs (Level 3 measurements). These tiers include:
| • | Level 1, defined as observable inputs such as quoted prices for identical instruments in active markets; |
| • | Level 2, defined as inputs other than quoted prices in active markets that are either directly or indirectly observable such as quoted prices for similar instruments in active markets or quoted prices for identical or similar instruments in markets that are not active; and |
| • | Level 3, defined as unobservable inputs in which little or no market data exists, therefore requiring an entity to develop its own assumptions, such as valuations derived from valuation techniques in which one or more significant inputs or significant value drivers are unobservable. |
In some circumstances, the inputs used to measure fair value might be categorized within different levels of the fair value hierarchy. In those instances, the fair value measurement is categorized in its entirety in the fair value hierarchy based on the lowest level input that is significant to the fair value measurement.
Derivative Warrant Liabilities
The Company does not use derivative instruments to hedge exposures to cash flow, market, or foreign currency risks. The Company evaluates all of its financial instruments, including issued stock purchase warrants, to determine if such instruments are derivatives or contain features that qualify as embedded derivatives, pursuant to ASC 480 and FASB ASC Topic 815, “Derivatives and Hedging” (“ASC 815”). The classification of derivative instruments, including whether such instruments should be recorded as liabilities or as equity, is
re-assessed
at the end of each reporting period. The warrants issued in the Initial Public Offering (the “Public Warrants” and together with the Private Placement Warrants, the “Warrants”) and the Private Placement Warrants are recognized as derivative liabilities in accordance with ASC 815. Accordingly, the Company recognizes the warrant instruments as liabilities at fair value and adjusts the carrying value of the instruments to fair value at each reporting period for so long as they are outstanding. The initial fair value of the Public Warrants issued in connection with the Public Offering and the fair value of the Private Placement Warrants have been estimated using a Monte Carlo simulation model and
F-26 |
subsequently, the fair value of the Private Placement Warrants have been estimated using a Monte Carlo simulation model at each measurement date. The fair value of the Public Warrants have subsequently been measured based on the listed market price of such warrants. The fair value of the Public Warrants as of June 30, 2021 is based on observable listed prices for such warrants. Derivative warrant liabilities are classified as
non-current
liabilities as their liquidation is not reasonably expected to require the use of current assets or require the creation of current liabilities. Offering Costs Associated with the Initial Public Offering
Offering costs consisted of legal, accounting, underwriting and other costs incurred that were directly related to the Initial Public Offering. Offering costs are allocated to the separable financial instruments issued in the Initial Public Offering based on a relative fair value basis, compared to total proceeds received. Offering costs associated with warrant liabilities are expensed as incurred, presented as 1.1 million was expensed for the six months ended June 30, 2021. Offering costs associated with the Class A ordinary shares were charged to shareholders’ equity upon the completion of the Initial Public Offering.
non-operating
expenses in the unaudited condensed consolidated statement of operations. Approximately $Class A Ordinary Shares Subject to Possible Redemption
The Company accounts for its Class A ordinary shares subject to possible redemption in accordance with the guidance in ASC 480. Class A ordinary shares subject to mandatory redemption (if any) are classified as liability instruments and are measured at fair value. Conditionally redeemable Class A ordinary shares (including Class A ordinary shares that feature redemption rights that are either within the control of the holder or subject to redemption upon the occurrence of uncertain events not solely within the Company’s control) are classified as temporary equity. At all other times, Class A ordinary shares are classified as shareholders’ equity. The Company’s Class A ordinary shares feature certain redemption rights that are considered to be outside of the Company’s control and subject to the occurrence of uncertain future events. Accordingly, at June 30, 2021 and December 31, 2020, 90,037,563 and 0 , respectively, Class A ordinary shares subject to possible redemption are presented as temporary equity, outside of the shareholders’ equity section of the Company’s balance sheets.
Income Taxes
The Company complies with the accounting and reporting requirements of ASC Topic 740, “Income Taxes,” which prescribes a recognition threshold and a measurement attribute for the financial statement recognition and measurement of tax positions taken or expected to be taken in a tax return. For those benefits to be recognized, a tax position must be no amounts accrued for interest and penalties as of June 30, 2021. The Company is currently not aware of any issues under review that could result in significant payments, accruals or material deviation from its position.
more-likely-than-not
to be sustained upon examination by taxing authorities. The Company’s management determined that the Cayman Islands is the Company’s only major tax jurisdiction. The Company recognizes accrued interest and penalties related to unrecognized tax benefits as income tax expense. There were no
unrecognized tax benefits and There is currently no taxation imposed on income by the Government of the Cayman Islands. In accordance with Cayman income tax regulations, income taxes are not levied on the Company. Consequently, income taxes are not reflected in the Company’s unaudited condensed consolidated financial statements. The Company’s management does not expect that the total amount of unrecognized tax benefits will materially change over the next twelve months.
F-27 |
Net Income (Loss) Per Ordinary Share
Net income (loss) per ordinary
share is computed by dividing net income (loss) by the weighted-average number of ordinary shares outstanding during the periods. The Company has not considered the effect of the warrants sold in the Initial Public Offering and the Private Placement to purchase an aggregate of 21,118,750 , of the Company’s Class A ordinary shares in the calculation of diluted net income (loss) per share, since their inclusion would be anti-dilutive under the treasury stock method.
The Company’s unaudited condensed consolidated statements of operations includes a presentation of net income (loss) per share for ord701,250 , available to be withdrawn from the Trust Account, by the weighted average number of Class A ordinary shares outstanding for the period. Net income (loss) per ordinary share, basic and diluted for Class B ordinary shares is calculated by dividing the net income (loss), less net income (loss) attributable to Class A ordinary shares by the weighted average number of Class B ordinary shares outstanding for the period. The basic and diluted income per common share is c
i
nary shares subject to redemption in a manner similar to the two-class
method of net income (loss) per share. Net income (loss) per ordinary share, basic and diluted for Class A ordinary shares is calculated by dividing the unrealized gain earned on investments held in the Trust Account, net of applicable taxes and interest to fund working capital requirements, subject to an annual limit of $a
lculated as follows: For the three months ended June 30, 2021 |
For the six months ended June 30, 2021 |
|||||||
Class A ordinary shares |
||||||||
Numerator: Earnings allocable to Class A ordinary shares |
||||||||
Unrealized gain on investments held in Trust Account |
$ | $ | ||||||
Less: Company’s portion available to be withdrawn to pay taxes |
$ | ( |
) | $ | ( |
) | ||
Net income attributable to Class A ordinary shares |
$ | — | $ | — | ||||
Denominator: Weighted average Class A ordinary shares |
||||||||
Basic and diluted weighted average shares outstanding |
||||||||
Basic and diluted net income per share |
$ | — | $ | — | ||||
Class B ordinary shares |
||||||||
Numerator: Net Loss minus Net Earnings allocable to Class A ordinary shares |
||||||||
Net loss |
$ | ( |
) | $ | ( |
) | ||
Net income allocable to Class A ordinary shares |
— | — | ||||||
Net loss allocable to Class B ordinary shares |
$ |
( |
) |
$ |
( |
) |
||
Denominator: weighted average Class B ordinary shares |
||||||||
Basic and diluted weighted average shares outstanding, Class B ordinary shares |
||||||||
Basic and diluted net loss per share, Class B ordinary shares |
$ |
( |
) |
$ |
( |
) |
||
Recent Accounting Pronouncements
In August 2020, the FASB issued Accounting Standards Update (“ASU”)
No. 2020-06, “Debt—Debt
with Conversion and Other Options (Subtopic 470-20) and
Derivatives and Hedging—Contracts in Entity’s Own Equity (Subtopic 815-40): Accounting
for Convertible Instruments and Contracts in an Entity’s OwnF-28 |
Equity” (“ASU 2020-06”), which simplifies accounting for convertible instruments by removing major separation models required under current U.S. GAAP. The ASU also removes certain settlement conditions that are required for equity-linked contracts to qualify for the derivative scope exception, and it simplifies the diluted earnings per share calculation in certain areas. The Company adopted
ASU 2020-06 on
January 1, 2021. Adoption of the ASU did not impact the Company’s financial position, results of operations or cash flows. The Company’s management does not believe that any other recently issued, but not yet effective, accounting pronouncement if currently adopted would have a material effect on the Company’s unaudited condensed consolidated financial statements.
Note 3—Initial Public Offering
On March 18, 2021, the Company consummated its Initial Public Offering of 97,750,000 Units, including 12,750,000 Over-Allotment Units, at $10.00 per Unit, generating gross proceeds of $977.5 54.5 million, of which approximately $34.2 18,000 was for deferred underwriting commissions and deferred legal fees, respectively.
Each Unit consists of one Class A ordinary share and
one-eighth
of one redeemable warrant. Each whole Public Warrant will entitle the holder to purchase one Class A ordinary share at an exercise price of $11.50
per share, subject to adjustment (see Note 7). Note 4—Private Placement
Substantially concurrently with the closing of the Initial Public Offering, the Company consummated the Private Placement of 8,900,000 Private Placement Warrants, at a price of $2.50 per Private Placement Warrant to the Sponsor, generating gross proceeds of approximately $22.3 million.
Each Private Placement Warrant is exercisable for one whole Class A ordinary share at a price of $11.50 per share. A portion of the proceeds from the sale of the Private Placement Warrants to the Sponsor was added to the proceeds from the Initial Public Offering held in the Trust Account. If the Company does not complete a Business Combination within the Combination Period, the Private Placement Warrants will expire worthless. The Private Placement Warrants will
be non-redeemable for
cash and exercisable on a cashless basis, except as described in Note 7, so long as they are held by the Sponsor or its permitted transferees. The Sponsor and the Company’s officers and directors agreed, subject to limited exceptions, not to transfer, assign or sell any of their Private Placement Warrants until 30 days after the completion of the initial Business Combination.
Note 5—Related Party Transactions
Founder Shares
On October 7, 2020, the Sponsor paid an aggregate of $25,000 to cover certain expenses on behalf of the Company in exchange for issuance of 2,875,000 24,437,500 Founder Shares outstanding. The Sponsor agreed to forfeit up to an aggregate of 3,187,500 Founder Shares, on a pro rata basis, to the extent that the option to purchase Over-Allotment Units was not exercised in full by the underwriters, so that the Founder Shares would represent 20 % of the Company’s issued and outstanding shares after the Initial Public Offering. Subsequent to the share capitalization, on February 10, 2021, the Sponsor
Class B
ordinary shares (the “Founder Shares”). On February 10, 2021, the Company effected a share capitalization resulting in an aggregate of F-29 |
transferred 30,000 Founder Shares to each of the Company’s independent director nominees.
The
underwriters fully exercised their over-allotment option on March 16, 2021; thus, those Founder Shares were no longer subject to forfeiture. The Initial Shareholders agreed not to transfer, assign or sell any of their Founder Shares until the earlier to occur of (1) one year after the completion of the initial Business Combination; and (2) subsequent to the initial Business Combination (x) if the last reported sale price of Class A ordinary shares equals or exceeds $12.00 per share (as adjusted for 20 trading days within 150 days after the initial Business Combination or (y) the date on which the Company completes a liquidation, merger, share exchange, reorganization or other similar transaction that results in all of the Public Shareholders having the right to exchange their ordinary shares for cash, securities or other property.
share sub-divisions, share
dividends, rights issuances, consolidations, reorganizations, recapitalizations and other similar transactions) for any any 30 -trading day
period commencing at least Related Party Loans
On October 7, 2020, the Sponsor agreed to loan the Company up to $300,000 295,000
to be used for the payment of costs related to the Initial Public Offering pursuant to a promissory note (the “Note”). The Note was non-interest bearing, unsecured and due upon the earlier of December 31, 2021 and the closing of the Initial Public Offering. The Company borrowed
$under the Note. The Company partially repaid the Note in full in March 2021 with proceeds from the Initial Public Offering.
In addition, in order to finance transaction costs in connection with a Business Combination, the Sponsor, members of the Company’s founding team or any of their affiliates may, but are not obligated to, loan the Company funds as may be required (“Working Capital Loans”). If the Company completes a Business Combination, the Company would repay the Working Capital Loans out of the proceeds of the Trust Account released to the Company. Otherwise, the Working Capital Loans would be repaid only out of funds held outside the Trust Account. In the event that a Business Combination does not close, the Company may use a portion of proceeds held outside the Trust Account to repay the Working Capital Loans but no proceeds held in the Trust Account would be used to repay the Working Capital Loans. The Working Capital Loans would either be repaid upon consummation of a Business Combination, without interest, or, at the lender’s discretion, up to $2.5 million of such Working Capital Loans may be convertible into warrants of the post Business Combination entity at a price of $2.50
per warrant. The warrants would be identical to the Private Placement Warrants. Except for the foregoing, the terms of such Working Capital Loans, if any, have not been determined and no written agreements exist with respect to such loans. As of June 30, 2021, the Company had no borrowings under the Working Capital Loans.
Support Services Agreement
The Company entered into a support services agreement (the “Support Services Agreement”) that provides that, commencing on the date that the Company’s securities were first listed on Nasdaq through the earlier of consummation of the initial Business Combination and the liquidation, the Company will pay
Support Services Fe390,600 and $468,800 in the condensed consolidated statement of operations for the three and six months ended June 30, 2021, the balance of approximately $468,800 is included in Due to related party on the unaudited condensed consolidated balance sheet at June 30, 2021.
e
s to Reinvent Capital LLC (“Reinvent Capital”) per year for support and administrative services, as well as reimburse Reinvent Capital for any out-of-pocket expenses it incurs in connection with providing services or for office space under the Support Services Agreement. As of June 30, 2021, the Company recognized approximately $In addition, the Sponsor, officers and directors, or any of their respective affiliates will be reimbursed for any expenses incurred in connection with activities on the Company’s behalf such as identifying
out-of-pocket
F-30 |
potential target businesses and performing due diligence on suitable Business Combinations. The Company’s audit committee will review on a quarterly basis all payments that were made to the Sponsor, officers or directors, or the Company’s or their affiliates. Any such payments prior to an initial Business Combination will be made from funds held outside the Trust Account, including funds released from the Trust Account to pay for working capital, subject to an annual limit of
$
. For the three and six months ended June 30, 2021, the Company incurred approximately $83,200
and $94,300
in reimbursable expenses paid by the Sponsor, which was recognized in the unaudited condensed consolidated statement of operations and $28,900
included in Due to Related Party on the unaudited condensed consolidated balance sheet at June 30, 2021.
Note 6—Commitments and Contingencies
Registration Rights
The holders of the Founder Shares, Private Placement Warrants and any warrants that may be issued upon conversion of Working Capital Loans (and any Class A ordinary shares issuable upon the exercise of the Private Placement Warrants or warrants issued upon conversion of the Working Capital Loans and upon conversion of the Founder Shares) are entitled to registration rights pursuant to a registration rights agreement. The holders of these securities are entitled to make up to three demands, excluding short form demands, that the Company registers such securities. In addition, the holders have certain “piggy-back” registration rights with respect to registration statements filed subsequent to the completion of the initial Business Combination. The Company will bear the expenses incurred in connection with the filing of any such registration statements.
Underwriting Agreement
The Company granted the underwriters a 45-day option from the date of the final prospectus related to the Initial Public Offering to purchase up to
Deferred Legal Fees
The Company engaged a legal counsel firm for legal advisory services, and the legal counsel agreed to defer certain of their fees until the consummation of the initial Business Combination. As of June 30, 2021, the Company recorded deferred legal fees of approximately
$in connection with such services on the accompanying condensed consolidated balance sheet.
Merger Agreement
On July 14, 2021, the Company entered into the Merger Agreement (as defined in Note 10) with Aurora (as defined in Note 10) and Merger Sub. The transactions contemplated by the Merger Agreement are described in more detail in Note 10.
F-31 |
Note 7—Shareholders’ Equity
Preference Shares
to
issue per share. As of June 30, 2021 and December 31, 2020, there were
Class
A Ordinary Shares
per share. As of
June 30, 2021 and December 31, 2020, there were
June 30, 2021 and December 31, 2020, there were
and 0
and 0 Class A ordinary shares subject to possible redemption, respectively.
Class
B Ordinary Shares
of the Company’s issued and outstanding ordinary shares after the Initial Public Offering. The underwriters fully exercised their over-allotment option on March 16, 2021; thus, those Founder Shares were no longer subject to forfeiture. At June 30, 2021 and December 31, 2020, 24,437,500
.
Class A ordinary shareholders and Class B ordinary shareholders of record are entitled to one vote
The Class B ordinary shares will automatically convert into Class A ordinary shares at the time of the initial Business Combination, or earlier at the option of the holder, on a basis, subject to adjustment for share 20 % of the sum of all ordinary shares issued and outstanding upon the completion of the Initial Public Offering plus all Class A ordinary shares and equity-linked securities issued or deemed issued in connection with the initial Business Combination, excluding any shares or equity-linked securities issued, or to be issued, to any seller in the initial Business Combination. In no event will the Class B ordinary shares convert into Class A ordinary shares at a rate of less than one to one.
one-for-one
sub-divisions,
share dividends, rights issuances, consolidations, reorganizations, recapitalizations and the like, and subject to further adjustment. In the case that additional Class A ordinary shares, or equity-linked securities, are issued or deemed issued in excess of the amounts issued in the Initial Public Offering and related to the closing of the initial Business Combination, the ratio at which the Class B ordinary shares will convert into Class A ordinary shares will be adjusted (unless the holders of a majority of the issued and outstanding Class B ordinary shares agree to waive such anti-dilution adjustment with respect to any such issuance or deemed issuance) so that the number of Class A ordinary shares issuable upon conversion of all Class B ordinary shares will equal, in the aggregate, on an as-converted
basis, Note 8—Derivative Warrant Liabilities
As of June 30, 2021 and December 31, 2020, the Company had 12,218,750 8,900,000
Public Warrants and
Private Placement Warrants outstanding.
Public Warrants may only be exercised for a whole number of shares. No fractional Public Warrants will be issued upon separation of the Units and only whole Public Warrants will trade. The Public Warrants will become
F-32 |
exercisable 30 days after the completion of a Business Combination, provided that the Company has an effective registration statement under the Securities Act covering the issuance of the Class A ordinary shares issuable upon exercise of the warrants and a current prospectus relating to them is available and such shares are registered, qualified or exempt from registration under the securities, or blue sky, laws of the state of residence of the holder (or the Company permits holders to exercise their warrants on a cashless basis under the circumstances specified in the warrant agreement governing the Warrants (the “Warrant Agreement”)). The Company has agreed that as soon as practicable, but in no event later than 15 business days after the closing of the initial Business Combination, the Company will use its commercially reasonable efforts to file with the SEC a post-effective amendment to the registration statement related to the Initial Public Offering or a new registration statement covering the issuance of the Class A ordinary shares issuable upon exercise of the warrants, and the Company will use its commercially reasonable efforts to cause the same to become effective within 60 business days after the closing of the initial Business Combination and to maintain the effectiveness of such registration statement and a current prospectus relating to those Class A ordinary shares until the warrants expire or are redeemed; provided that if the Class A ordinary shares are at the time of any exercise of a warrant not listed on a national securities exchange such that they satisfy the definition of a “covered security” under Section 18(b)(1) of the Securities Act, the Company may, at its option, requires holders of Public Warrants who exercise their warrants to do so on a “cashless basis” in accordance with Section 3(a)(9) of the Securities Act and, in the event the Company so elects, it will not be required to file or maintain in effect a registration statement.
The warrants have an exercise price of $11.50 per share, subject to adjustments, and will expire five years after the completion of a Business Combination or earlier upon redemption or liquidation. In addition, if (x) the Company issues additional ordinary shares or equity-linked securities for capital raising purposes in connection with the closing of the initial Business Combination at an issue price or effective issue price of less than $9.20 per ordinary share (with such issue price or effective issue price to be determined in good faith by the board of directors and, in the case of any such issuance to the Sponsor or its affiliates, without taking into account any Founder Shares held by the Sponsor or such affiliates, as applicable, prior to such issuance) (the “Newly Issued Price”), (y) the aggregate gross proceeds from such issuances represent more than 60 % of the total equity proceeds, and interest thereon, available for the funding of the initial Business Combination on the date of the completion of the initial Business Combination (net of redemptions), and (z) the volume weighted average trading price of Class A ordinary shares during the 20 trading day period starting on the trading day prior to the day on which the Company consummates its initial business Combination (such price, the “Market Value”) is below $9.20 per share, the exercise price of the warrants will be adjusted (to the nearest cent) to be equal to 115 % of the higher of the Market Value and the Newly Issued Price, the $18.00 per share redemption trigger price described below under “Redemption of warrants when the price per Class A ordinary share equals or exceeds $18.00” and “Redemption of warrants when the price per Class A ordinary share equals or exceeds $10.00” will be adjusted (to the nearest cent) to be equal to 180 % of the higher of the Market Value and the Newly Issued Price, and the $10.00 per share redemption trigger price described below under “Redemption of warrants when the price per Class A ordinary share equals or exceeds $10.00” will be adjusted (to the nearest cent) to be equal to the higher of the Market Value and the Newly Issued Price.
The Private Placement Warrants are identical to the Public Warrants underlying the Units sold in the Initial Public Offering, except that the Private Placement Warrants and the Class A ordinary shares issuable upon exercise of the Private Placement Warrants will not be transferable, assignable or salable until 30 days after the completion of a Business Combination, subject to certain limited exceptions. Additionally, the Private Placement Warrants will
be non-redeemable, except
as described below, so long as they are held by the initial purchasers or such purchasers’ permitted transferees. If the Private Placement Warrants are held by someone other than the Initial Shareholders or their permitted transferees, the Private Placement Warrants will be redeemable by the Company and exercisable by such holders on the same basis as the Public Warrants.F-33 |
Once the Warrants become exercisable, the Company may redeem the outstanding Warrants (except as described herein with respect to the Private Placement Warrants):
| • | in whole and not in part; |
| • | at a price of $ W arrant; |
| • | upon not less than W arrant holder; and |
| • | if, and only if, the last reported sale price of Class A ordinary shares for any a period ending on the third trading day prior to the date on which the Company sends the notice of redemption to the W arrant holders (the “Reference Value”) equals or exceeds $18.00 per share (as adjusted). |
The Company will not redeem the Warrants as described above unless a registration statement under the Securities Act covering the issuance of the Class A ordinary shares issuable upon exercise of the Warrants is then effective and a current prospectus relating to those Class A ordinary shares is available throughout the
30-day
redemption period. If and when the Warrants become redeemable by the Company, it may exercise its redemption right even if the Company is unable to register or qualify the underlying securities for sale under all applicable state securities laws. Redemption of Warrants when the price per Class A ordinary share equals or exceeds $10.00:
Once the Warrants become exercisable, the Company may redeem the outstanding Warrants (except as described herein with respect to the Private Placement Warrants):
| • | in whole and not in part; |
| • | at $ W arrant upon a minimum of W arrants on a cashless basis prior to redemption and receive that number of shares determined by reference to an agreed table based on the redemption date and the “fair market value” of Class A ordinary shares; |
| • | if, and only if, the Reference Value equals or exceeds $ |
| • | if the Reference Value is less than $ |
The “fair market value” of Class A ordinary shares shall mean the volume-weighted average price of Class A ordinary shares for the 10 trading days following the date on which the notice of redemption is sent to the holders of Warrants. In no event will the Warrants be exercisable in connection with this redemption feature for more than 0.361 Class A ordinary shares per Warrant (subject to adjustment).
In no event will the Company be required to net cash settle any Warrant. If the Company is unable to complete a Business Combination within the Combination Period and the Company liquidates the funds held in the Trust Account, holders of Warrants will not receive any of such funds with respect to their warrants, nor will they receive any distribution from the Company’s assets held outside of the Trust Account with the respect to such Warrants. Accordingly, the Warrants may expire worthless.
F-34 |
Note 9—Fair Value Measurements
The following table presents information about the Company’s assets and liabilities that are measured at fair value on a recurring basis as of June 30, 2021 and indicates the fair value hierarchy of the valuation techniques that the Company utilized to determine such fair value.
Description |
Quoted Prices in Active Markets (Level 1) |
Significant Other Observable Inputs (Level 2) |
Significant Other Unobservable Inputs (Level 3) |
|||||||||
Assets: |
||||||||||||
Investments held in Trust Account – U.S. Treasury Securities Money Market Fund |
$ | $ | — | $ | — | |||||||
Liabilities: |
||||||||||||
Derivative warrant liabilities – public warrants |
$ | $ | — | $ | — | |||||||
Derivative warrant liabilities – private warrants |
$ | — | $ | — | $ |
|
||||||
Transfers to/from Levels 1, 2, and 3 are recognized at the beginning of the reporting period. The estimated fair value of the Public Warrants transferred from a Level 3 measurement to a Level 1 fair value measurement in May 2021, when the Public Warrants were separately listed and traded.
Level 1 instruments include investments in money market funds and U.S. Treasury securities. The Company uses inputs such as actual trade data, benchmark yields and quoted market prices from dealers or brokers.
The fair value of the Public Warrants and Private Placement Warrants were initially measured at fair value using a Monte Carlo simulation model and subsequently and the fair value of the Private Placement Warrants have been estimated using a Monte Carlo simulation model at each subsequent measurement date. For the three and six months ended June 30, 2021, the Company recognized a charge to the condensed consolidated statement of operations resulting from an increase in the fair value of liabilities of approximately $2.8 million and $3.8 million, respectively, presented as change in fair value of derivative warrant liabilities on the accompanying condensed consolidated statement of operations.
The estimated fair value of the Private Placement Warrants, and the Public Warrants prior to being separately listed and traded, was determined using Level 3 inputs. Inherent in a Monte Carlo simulation are assumptions related to expected stock-price volatility, expected life, risk-free interest rate and dividend yield. The Company estimates the volatility of its warrants based on implied volatility from the Company’s traded warrants and from historical volatility of select peer company’s common stock that matches the expected remaining life of the warrants. The risk-free interest rate is based on the U.S. Treasury
zero-coupon
yield curve on the grant date for a maturity similar to the expected remaining life of the warrants. The expected life of the warrants is assumed to be equivalent to their remaining contractual term. The dividend rate is based on the historical rate, which the Company anticipates remaining at zero.F-35 |
T
he following table provides quantitative information regarding Level 3 fair value measurements inputs at their measurement dates: As of June 30, 2021 |
||||
Stock price |
$ |
|
||
Volatility |
|
% | ||
Expected life of the options to convert |
||||
Risk-free rate |
% | |||
Dividend yield |
|
|||
The change in the fair value of the Level 3 derivative warrant liabilities for three months ended June 30, 2021 is summarized as follows:
Public Warrants |
Private Warrants |
Total |
||||||||||
Derivative warrant liabilities at December 31, 2020 |
$ |
|
$ |
|
$ |
|
||||||
Issuance of derivative warrant liabilities |
||||||||||||
Transfer of Public Warrants to Level 1 |
( |
) | — | ( |
) | |||||||
Change in fair value of derivative warrant liabilities |
|
|||||||||||
Derivative warrant liabilities at June 30, 2021 |
$ |
|
$ | $ | ||||||||
Note 10—Subsequent Events
Management has evaluated subsequent events to determine if events or transactions occurring through the date these condensed consolidated financial statements were issued, require potential adjustment to or disclosure in these condensed consolidated financial statements and has concluded that all such events that would require recognition or disclosure have been recognized or disclosed, including the following items.
Aurora Business Combination
On July 14, 2021, the Company entered into an Agreement and Plan of Merger (the “Merger Agreement”) with Aurora Innovation, Inc., a Delaware corporation (“Aurora”), and Merger Sub.
The Merger Agreement provides that, among other things and upon the terms and subject to the conditions thereof, the following transactions will occur (together with the other agreements and transactions contemplated by the Merger Agreement, the “Aurora Business Combination”):
| • | at the closing of the transactions contemplated by the Merger Agreement (the “Closing”), upon the terms and subject to the conditions of the Merger Agreement, in accordance with the General Corporation Law of the State of Delaware, as amended (the “DGCL”), Merger Sub will merge with and into Aurora, the separate corporate existence of Merger Sub will cease and Aurora will be the surviving corporation and a wholly owned subsidiary of the Company (the “Merger”); |
| • | upon the effective time of the Domestication (defined below), the Company will immediately be renamed “Aurora Innovation, Inc.” (after the Domestication, the Company is referred to as “Aurora Innovation”); |
F-36 |
| • | as a result of the Merger, among other things, all outstanding shares of Aurora capital stock will be cancelled in exchange for the right to receive shares of Aurora Innovation Class A common stock (at a deemed value of $ a pre-transaction equity value of Aurora of $ |
| • | as a result of the Merger, all outstanding Aurora equity awards outstanding as of immediately prior to the effective time of the Merger that will be converted into awards based on Aurora Innovation Class A common stock. |
Prior to the Closing, subject to the approval of the Company’s shareholders, and in accordance with the DGCL, Cayman Islands Companies Act (as revised) (the “CICA”) and the Company’s Amended and Restated Memorandum and Articles of Association, the Company will effect a deregistration under the CICA and a domestication under Section 388 of the DGCL, pursuant to which the Company’s jurisdiction of incorporation will be changed from the Cayman Islands to the State of Delaware (the “Domestication”).
In connection with the Domestication, (i) each of the then issued and outstanding Class A ordinary shares will convert automatically, on into a share of Aurora Innovation Class A common stock, (ii) each of the then issued and outstanding Class B ordinary shares will convert automatically, on into a share of Aurora Innovation Class A common stock, (iii) each then issued and outstanding warrant of the Company will convert automatically into a warrant to acquire one share of Aurora Innovation Class A common stock, pursuant to the Warrant Agreement, between the Company and Continental Stock Transfer & Trust Company, as warrant agent, and (iv) each then issued and outstanding Unit will separate automatically into a share of Aurora Innovation Class A common stock, on
one-for-one basis ,
a one-for-one basis,
a one-for-one basis,
a
and one-eighth of
one Aurora Innovation Class A common stock.On July 14, 2021, concurrently with the execution of the Merger Agreement, the Company entered into subscription agreements with certain investors, pursuant to, and on the terms and subject to the conditions of which, such investors have collectively subscribed for 100 million shares of Aurora Innovation Class A common stock for an aggregate purchase price equal to $1 billion (the “PIPE Investment”). The PIPE Investment will be consummated substantially concurrently with the Closing.
On July 14, 2021, the Company entered into the Sponsor Agreement (the “Sponsor Agreement”) with the Sponsor and Aurora, pursuant to which the parties thereto agreed, among other things, that (i) in the event that more than 22.5 % of the outstanding Class A ordinary shares are redeemed, and the Sponsor, any affiliate of the Sponsor or any other person arranged by the Sponsor has not provided backstop or alternative financing to replace such redemptions above the 22.5% threshold, the Sponsor will forfeit a number of Class B ordinary shares then owned by the Sponsor immediately before the Domestication, with such number of forfeited Class B ordinary shares calculated on a sliding scale tied to the unreplaced redemptions, (ii) subject to the forfeiture (if any) described in the immediately preceding clause, shares of Aurora Innovation Class A common stock held by the Sponsor as of the Domestication will be subject to certain vesting 20 trading days within 18.00 per share (subject to
and lock-up terms,
(iii) the Sponsor will exercise all of its Aurora Innovation Class Warrants acquired by the Sponsor in the Private Placement for cash or on a “cashless basis” on or prior to the date upon which Aurora Innovation elects to redeem the public Aurora Innovation Class A Warrants in accordance with the Warrant Agreement, if the last reported sales price of the Aurora Innovation Class A common stock for any the 30 trading-day period ending
on the third trading day prior to the date on which notice of the redemption is given exceeds $F-37 |
certain adjustments), and (iv) our Sponsor will have the right to designate a Class III director to Aurora Innovation’s Board of Directors for the first and second terms of the Class III directors.
The consummation of the proposed Aurora Business Combination is subject to certain conditions as further described in the Merger Agreement.
F-38 |
Report of Independent Registered Public Accounting Firm
To the Board of Directors
Aurora Innovation, Inc.:
Opinion on the Financial Statements
We have audited the accompanying balance sheets of Aurora Innovation, Inc. (the Company) as of
December 31, 2020 and 2019, the related statements of operations, comprehensive loss, redeemable convertible preferred stock and stockholders’ deficit, and cash flows for each of the years in the
two-year
period ended December 31, 2020, and the related notes (collectively, the financial statements). In our opinion, the financial statements present fairly, in all material respects, the financial position of the Company as of December 31, 2020 and 2019, and the results of its operations and its cash flows for each of the years in the two-year
period ended December 31, 2020, in conformity with U.S. generally accepted accounting principles. Basis for Opinion
These financial statements are the responsibility of the Company’s management. Our responsibility is to express an opinion on these financial statements based on our audits. We are a public accounting firm registered with the Public Company Accounting Oversight Board (United States) (PCAOB) and are required to be independent with respect to the Company in accordance with the U.S. federal securities laws and the applicable rules and regulations of the Securities and Exchange Commission and the PCAOB.
We conducted our audits in accordance with the standards of the PCAOB and in accordance with auditing standards generally accepted in the United States of America. Those standards require that we plan and perform the audit to obtain reasonable assurance about whether the financial statements are free of material misstatement, whether due to error or fraud. Our audits included performing procedures to assess the risks of material misstatement of the financial statements, whether due to error or fraud, and performing procedures that respond to those risks. Such procedures included examining, on a test basis, evidence regarding the amounts and disclosures in the financial statements. Our audits also included evaluating the accounting principles used and significant estimates made by management, as well as evaluating the overall presentation of the financial statements. We believe that our audits provide a reasonable basis for our opinion.
/s/ KPMG LLP
We have served as the Company’s auditor since 2018.
Santa Clara, California
July 15, 2021
F-39
AURORA INNOVATION, INC.
Balance Sheets
December 31, 2020 and 2019
(in thousands, except per share data)
December 31, 2020 |
December 31, 2019 |
|||||||
| Assets |
||||||||
| Current assets |
||||||||
| Cash and cash equivalents |
$ | $ | ||||||
| Restricted cash |
||||||||
| Short-term investments |
|
|||||||
| Prepaid expenses and other current assets |
||||||||
| |
|
|
|
|||||
| Total current assets |
||||||||
| Property and equipment, net |
||||||||
| Operating lease right-of-use |
||||||||
| Restricted cash, long term |
||||||||
| Other assets |
||||||||
| Acquisition related intangible assets |
||||||||
| Goodwill |
||||||||
| |
|
|
|
|||||
| Total assets |
$ | $ | ||||||
| |
|
|
|
|||||
| Liabilities, Redeemable Convertible Preferred Stock, and Stockholders’ Deficit |
||||||||
| Current Liabilities |
||||||||
| Accounts payable |
$ | $ | ||||||
| Accrued expenses and other liabilities |
||||||||
| Operating lease liabilities, current |
||||||||
| |
|
|
|
|||||
| Total current liabilities |
||||||||
| Operating lease liabilities, long-term |
||||||||
| Deferred tax liability |
||||||||
| Other long-term liabilities |
||||||||
| |
|
|
|
|||||
| Total liabilities |
$ | $ | ||||||
| |
|
|
|
|||||
| Redeemable convertible preferred stock |
||||||||
| Redeemable convertible preferred stock, $ |
||||||||
| Stockholders’ deficit |
||||||||
| Common stock, $ |
||||||||
| Additional paid-in capital |
||||||||
| Accumulated other comprehensive income |
|
|||||||
| Accumulated deficit |
( |
) | ( |
) | ||||
| |
|
|
|
|||||
| Total stockholders’ deficit |
( |
) | ( |
) | ||||
| |
|
|
|
|||||
| Total liabilities redeemable convertible preferred stock, and stockholder’s deficit |
$ | $ | ||||||
| |
|
|
|
|||||
F-40
AURORA INNOVATION, INC.
Statements of Operations
Years ended December 31, 2020 and 2019
(in thousands)
|
Years Ended December 31, |
||||||||
2020 |
2019 |
|||||||
| Development services revenue |
$ |
|
$ | |||||
| Operating expenses: |
||||||||
| Cost of revenue |
|
|||||||
| Research and development |
||||||||
| Selling general and administrative |
||||||||
| |
|
|
|
|||||
| Total operating expenses |
||||||||
| |
|
|
|
|||||
| Loss from operations |
( |
) | ( |
) | ||||
| Other income (expense): |
||||||||
| Interest income |
||||||||
| Other expense |
( |
) | ( |
) | ||||
| |
|
|
|
|||||
| Loss before income taxes |
( |
) | ( |
) | ||||
| Income tax expense (benefit) |
( |
) | ||||||
| |
|
|
|
|||||
| Net loss |
$ | ( |
) | $ | ( |
) | ||
| |
|
|
|
|||||
| Basic and diluted net loss per share |
( |
) | ( |
) | ||||
| |
|
|
|
|||||
| Basic and diluted weighted-average shares outstanding |
$ | $ | ||||||
| |
|
|
|
|||||
F-41
AURORA INNOVATION, INC.
Statements of Comprehensive Loss
Years ended December 31, 2020 and 2019
(in thousands)
|
Twelve Months Ended December 31, |
||||||||
2020 |
2019 |
|||||||
| Net Loss |
$ | ( |
) | $ | ( |
) | ||
| Other comprehensive Income: |
||||||||
| Available-for sale investments |
||||||||
| Net unrealized gain (loss) |
( |
) | ||||||
| |
|
|
|
|||||
| Net Change |
( |
) | ||||||
| |
|
|
|
|||||
| Other Comprehensive Income (loss) |
( |
) | ||||||
| |
|
|
|
|||||
| Comprehensive Loss |
$ | ( |
) | $ | ( |
) | ||
| |
|
|
|
|||||
F-42
AURORA INNOVATION, INC.
Statements of Redeemable Convertible Preferred Stock and Stockholders’ Deficit
12 Months Ended December 31, 2020 and 2019
(in thousands, except per share data)
|
Redeemable Convertible Preferred stock |
Common stock |
Additional Paid-in
capital |
Accumulated other comprehensive income |
Accumulated deficit |
Total Stockholders’ Deficit |
|||||||||||||||||||||||||||
Shares |
Amount |
Shares |
Amount |
|||||||||||||||||||||||||||||
| Balance as of December 31, 2018 |
$ | $ | $ | $ | — | $ | ( |
) | $ | ( |
) | |||||||||||||||||||||
| Issuance of Series B redeemable convertible preferred stock at $ |
— | — | — | — | — | — | ||||||||||||||||||||||||||
| Issuance of Series B redeemable convertible preferred stock at $ |
— | — | — | — | — | — | ||||||||||||||||||||||||||
| Issuance of Series B-1 redeemable convertible preferred stock at $ |
— | — | — | — | — | — | ||||||||||||||||||||||||||
| Issuance of common stock in relation to acquisition |
— | — | — | — | — | |||||||||||||||||||||||||||
| Issuance of common stock upon exercise of stock options |
— | — | — | — | — | |||||||||||||||||||||||||||
| Vesting of early exercised stock options |
— | — | — | — | — | |||||||||||||||||||||||||||
| Vesting of restricted stock |
— | — | ( |
) | — | — | ||||||||||||||||||||||||||
| Cancellation of restricted stock |
— | — | ( |
) | — | — | — | — | ||||||||||||||||||||||||
| Stock-based compensation |
— | — | — | — | — | — | ||||||||||||||||||||||||||
| Unrealized gain on held for sale investments |
— | — | — | — | — | — | ||||||||||||||||||||||||||
| Net Loss |
— | — | — | — | — | — | ( |
) | ( |
) | ||||||||||||||||||||||
| |
|
|
|
|
|
|
|
|
|
|
|
|
|
|
|
|||||||||||||||||
| Balance as of December 31, 2019 |
$ | $ | $ | $ | $ | ( |
) | $ | ( |
) | ||||||||||||||||||||||
| Issuance of common stock upon exercise of stock options |
— | — | — | — | — | |||||||||||||||||||||||||||
| Vesting of early exercised stock options |
— | — | — | — | — | |||||||||||||||||||||||||||
| Vesting of restricted stock |
— | — | ( |
) | — | — | — | |||||||||||||||||||||||||
| Repurchase of series B redeemable convertible preferred stock at $ |
( |
) | ( |
) | — | — | — | — | — | |||||||||||||||||||||||
| Stock-based compensation |
— | — | — | — | — | — | ||||||||||||||||||||||||||
| Unrealized loss on held for sale investments |
— | — | — | — | — | ( |
) | — | ( |
) | ||||||||||||||||||||||
| Net loss |
— | — | — | — | — | — | ( |
) | ( |
) | ||||||||||||||||||||||
| |
|
|
|
|
|
|
|
|
|
|
|
|
|
|
|
|||||||||||||||||
| Balance as of December 31, 2020 |
$ | $ | $ | $ | — | $ | ( |
) | $ | ( |
) | |||||||||||||||||||||
| |
|
|
|
|
|
|
|
|
|
|
|
|
|
|
|
|||||||||||||||||
| F-43 |
AURORA INNOVATION, INC.
Statement of Cash Flows
Years ended December 31
(in thousands)
2020 |
2019 |
|||||||
| Cash flows from operating activities: |
||||||||
| Net loss |
$ | ( |
) | $ | ( |
) | ||
| Adjustment to reconcile net loss to net cash used in operating activities: |
||||||||
| Depreciation and amortization |
||||||||
| Reduction in the carrying amount of ROU assets |
||||||||
| Accretion of discount on short-term investments |
( |
) | ( |
) | ||||
| Loss on disposal of equipment |
|
|||||||
| Stock based compensation |
||||||||
| Change in deferred tax asset valuation allowance |
|
( |
) | |||||
| Changes in operating assets and liabilities: |
||||||||
| Accounts receivable |
|
|||||||
| Prepaid expenses and other current assets |
( |
) | ( |
) | ||||
| Other assets |
( |
) | ( |
) | ||||
| Accounts payable |
( |
) | ||||||
| Accrued expenses and other current and non-current liabilities |
||||||||
| Operating lease liability |
( |
) | ( |
) | ||||
| Deferred revenue |
|
( |
) | |||||
| |
|
|
|
|||||
| Net cash used in operating activities |
( |
) | ( |
) | ||||
| |
|
|
|
|||||
| Cash flows from investing activities: |
||||||||
| Purchases of property and equipment |
( |
) | ( |
) | ||||
| Proceeds from sale of property and equipment |
|
|||||||
| Purchase of business, net of cash acquired |
|
( |
) | |||||
| Purchase of short-term investments |
( |
) | ( |
) | ||||
| Maturities of short-term investments |
||||||||
| |
|
|
|
|||||
| Net cash provided (used) by investing activities |
( |
) | ||||||
| |
|
|
|
|||||
| Cash flows from financing activities: |
||||||||
| Proceeds from early exercised stock options |
||||||||
| Payments to repurchase unvested early exercised stock options |
( |
) | ( |
) | ||||
| Payments to repurchase (proceeds from issuance of) series B preferred stock, net |
( |
) | ||||||
| Proceeds from issuance of common stock |
||||||||
| |
|
|
|
|||||
| Net cash provided by financing activities |
||||||||
| |
|
|
|
|||||
| Net increase in cash, cash equivalents, and restricted cash |
$ | $ | ||||||
| Cash, cash equivalents, and restricted cash at beginning of the period |
||||||||
| |
|
|
|
|||||
| Cash, cash equivalents, and restricted cash at end of the period |
$ | $ | ||||||
| |
|
|
|
|||||
F-44
AURORA INNOVATION, INC.
Notes to Financial Statements
Years ended December 31, 2020 and 2019
(in thousands, except share data)
(1) |
Overview and Organization |
Aurora Innovation, Inc. (the Company) was initially formed as a Delaware limited liability company in October 2016, then converted to a Delaware corporation in March 2017. The Company has offices in six cities: Palo Alto, Mountain View, and San Francisco, California; Pittsburgh, Pennsylvania; Bozeman, Montana; and Coppell, Texas. The Company designs and develops the Aurora Driver, which is the hardware, software, and data services that allow vehicles to drive themselves.
(2) |
Summary of Significant Accounting Policies |
| (a) | Basis of Presentation |
The preparation of financial statements in conformity with U.S. generally accepted accounting principles requires management to make estimates and assumptions that affect the reported amounts of assets and liabilities and disclosure of contingent assets and liabilities at the date of the financial statements and the reported amounts of revenue and expenses during the reporting period. Actual results could differ from those estimates. Significant items subject to such estimates and assumptions include the useful lives of property and equipment; valuation allowance for deferred income tax assets, valuation of intangible assets, fair value of options granted under the Company’s stock-based compensation plans, present value of the lease liability, and the assumptions used in determining the recognition of revenue.
| (b) | Forward Stock Split |
On May 7, 2019, the Company effected a 10-for-1 forward stock split of its outstanding common stock, preferred stock and stock options. All share and per share amounts for all periods presented in the financial statements and notes thereto have been adjusted retrospectively, where applicable, to reflect this forward stock split.
| (c) | Cash and Cash Equivalents |
The Company considers all highly liquid investments with a maturity, when purchased, of 90 days or less to be cash equivalents. The recorded carrying value of cash equivalents approximates their fair value.
| (d) | Restricted Cash |
Restricted cash consists of funds that are contractually restricted as to usage or withdrawal due to the signing of the Company’s operating lease agreements. The Company has presented restricted cash separately from cash and cash equivalents on the balance sheet.
| (e) | Short-term Investments |
The company typically invests in U.S. Treasury securities and classifies its short-term investments as In general, these investments are free of trading restrictions. The Company carries these at fair value, based on quoted market prices or other readily available market information. Unrealized gains and losses, net of taxes are included in accumulated other comprehensive loss, which is reflected as a separate component of stockholders’ equity in the Company’s balance sheets. Gains and losses are recognized when realized in the Company’s statements of operations. When the Company has determined that an other-than-temporary decline in fair value has occurred, the amount of the decline that is related to a credit loss is recognized in income. Gains and losses are determined using the specific identification method.
available-for-sale.
| F-45 |
The Company may sell its short-term investments at any time, without significant penalty, for use in current operations or for other purposes, even if they have not yet reached maturity. As a result, the Company has classified its investments as current assets in the accompanying balance sheets. Securities with original or remaining maturities of 90 days or less on the purchase date are considered to be cash equivalents and are reflected in cash and cash equivalents in the accompanying balance sheets.
| (f) | Revenue Recognition |
The Company generated revenue primarily from nonrecurring development service agreements and determines revenue recognition in accordance with Accounting Standards Codification (ASC) Topic 606, , through the following steps:
Revenue from Contracts with Customers
Identification of the contract, or contracts, with a customer –
Identification of the performance obligations in the contract –
Determination of the transaction price –
value-add,
and other taxes the Company collects from customers concurrent with revenue-producing activities are excluded from revenue. None of the Company’s contracts contain a significant financing component. Allocation of the transaction price to the performance obligations in the contract –
| F-46 |
Recognition of revenue when, or as, performance obligations are satisfied –
| (g) | Property and Equipment |
Property and equipment are stated at cost and depreciated using the straight-line method over the estimated useful lives of the assets (three to five years). Leasehold improvements are amortized over the lesser of the asset’s useful life (seven years) or the remaining lease term.
| (h) | Other Current Assets |
Other current assets consist of prepaid expenses, interest receivable, and security deposits.
(i) |
Leases |
The Company determines if an arrangement is a lease at inception. All leases are assessed for classification as an operating lease or a finance lease. Operating lease liabilities are recognized based on the present value of the future minimum lease payments over the lease term at the lease commencement date. The interest rate used to determine the present value of future payments is the Company’s incremental borrowing rate because the rate implicit in the Company’s leases is not readily determinable. The incremental borrowing rate, calculated based on available information at the lease commencement date, is a hypothetical rate for collateralized borrowings in economic environments where the leased asset is located based on credit rating factors. The Company’s right of use (ROU) assets are also recorded at the applicable lease commencement date. The ROU assets equals the amount of the related lease liability, adjusted for prepaid lease payments made prior to the lease commencement date, lease incentives and initial direct costs.
Certain lease contracts include obligations to pay for other services, such as operations and maintenance. The Company elected the practical expedient whereby the Company records all lease components and the related minimum
non-lease
components as a single lease component. Cash payments made for variable lease costs, such as maintenance and tenant improvements, are not included in the measurement of the Company’s operating lease assets and liabilities as of the lease commencement date. The Company does not include variable payments in the calculation of the ROU asset at the commencement of the lease, however if the variable payments are based on a contingent event, and that contingent event is ultimately resolved, the ROU asset is re-measured
and all such variable payments are then included. Many of the Company’s lease terms include one or more options to renew. The Company does not assume renewals in the determination of the lease term unless it is reasonably certain that the Company will exercise that option. Lease costs for minimum lease payments for operating leases is recognized on a straight-line basis over the lease term. The Company’s lease agreements do not contain any residual value guarantees. The Company has elected to not recognize a lease liability or (ROU) asset for short-term leases, which are defined as leases with a term of twelve months or less that do not include an option to purchase the underlying asset.
right-of-use
| (j) | Business Combinations |
The Company allocates the fair value of purchase consideration to the tangible assets acquired, liabilities assumed, and intangible assets acquired based on their estimated fair values. The excess of
| F-47 |
the fair value of purchase consideration over the fair values of these identifiable assets and liabilities is recorded as goodwill. Such valuations require management to make significant estimates and assumptions, especially with respect to intangible assets. Significant estimates in valuing certain intangible assets include, but are not limited to, estimated replacement cost, profit margin, opportunity cost, useful lives, and discount rates. Management’s estimates of fair value are based upon assumptions believed to be reasonable, but which are inherently uncertain and unpredictable and, as a result, actual results may differ from estimates. During the measurement period, the Company may record adjustments to the assets acquired and liabilities assumed, with the corresponding offset to goodwill. Upon the conclusion of the measurement period, any subsequent adjustments are recorded to earnings.
| (k) | Goodwill, Acquired Intangible Assets, and Impairment of Long-Lived Assets |
(i) |
Goodwill |
Goodwill represents the excess purchase consideration of acquired businesses over the estimated fair value of the net assets acquired and is not amortized. Goodwill is evaluated for impairment annually on December 31, or whenever events or circumstances indicate that the carrying amount may not be recoverable. If the carrying amount of a reporting unit exceeds its fair value, an impairment loss is recognized for any excess of the carrying amount of the reporting unit’s goodwill over the implied fair value of the goodwill. The Company did not record any impairment to goodwill in any of the periods presented.
(ii) |
Acquired Intangible Assets |
Acquired Intangible Assets consist of
in-process
research and development (IPR&D) from the Company’s acquisition of Blackmore Sensors and Analytics. The IPR&D has an indefinite useful life and is tested for impairment annually until completion. As of December 31, 2020 the Company notes the IPR&D has not been completed. (iii) |
Impairment of Long-Lived Assets |
Long-lived assets, such as property and equipment, are reviewed for impairment whenever events or changes in circumstances indicate that the carrying amount of an asset may not be recoverable. If circumstances require a long-lived asset or asset group be tested for possible impairment, the Company first compares undiscounted cash flows expected to be generated by that asset or asset group to its carrying amount. If the carrying amount of the long-lived asset or asset group is not recoverable on an undiscounted cash flow basis, an impairment is recognized to the extent that the carrying amount exceeds its fair value. Fair value is determined using various valuation techniques, including discounted cash flow models, quoted market values, and third-party independent appraisals, as considered necessary. No
| (l) | Cost of Development Services Revenue |
Costs of development services revenue is comprised primarily of the costs associated to deliver custom hardware design and development services for operating a customer’s vehicle platform with the Aurora Driver. These costs consist primarily of payroll, payroll related expense, stock-based compensation and allocated overhead that are incurred as the Company performs the underlying services related to satisfying the performance obligations under the development services agreements.
| (m) | Research and Development Costs |
Research and development costs are expensed as incurred. Research and development costs consist primarily of payroll, hardware and electrical engineering prototyping, cloud computing, data labeling,
| F-48 |
and third-party development services and are included in research and development in the accompanying statement of operations.
| (n) | Advertising Costs |
Advertising costs are expensed as incurred and are included in selling, general, and administrative in the accompanying statement of operations. There were no
| (o) | Software Development Costs |
The Company follows the provisions of ASC (“ASC
985-20,
Software – Costs of Software to be Sold, Leased, or Marketed
985-20”).
Costs have not yet met the criteria for capitalization as technological feasibility has not been established as defined by ASC 985-20.
| (p) | Income Taxes |
The Company accounts for income taxes using the method. ASC 740, , requires the recognition of deferred tax assets and liabilities based upon the temporary differences between the financial reporting and tax bases of assets and liabilities and using enacted rates in effect for the years in which the differences are expected to reverse. Valuation allowances are established when necessary to reduce the deferred tax assets when it is more likely than not that a portion or all of the deferred tax assets will not be realized.
asset-and-liability
Accounting for Income Taxes
ASC 740 prescribes a recognition threshold and measurement attribute for the financial statement recognition and measurement of a tax position taken or expected to be taken on a tax return and provides guidance on derecognition, classification, interest and penalties, accounting in interim periods, disclosure, and transition. The Company records uncertain tax positions on the basis of a 50 % likely to be realized upon ultimate settlement with the related tax authority.
two-step
process in which: (1) the Company determines whether it is more likely than not that the tax positions will be sustained on the basis of technical merits of the position, and (2) for those tax positions that meet the more likely than not recognition threshold, the Company recognizes the tax benefit as the largest amount that is cumulatively more than | (q) | Stock-based Compensation |
The Company recognizes share-based compensation cost using the fair value method of accounting. The fair value of the Company’s stock options are measured based on the grant-date fair value which is calculated using a Black-Scholes option pricing model. The fair value of the stock-based compensation is recognized on a straight-line basis over the requisite service period, which is generally the vesting period. The Company recognizes the effect of forfeitures in the period they occur.
| (r) | Commitments and Contingencies |
Liabilities for loss contingencies arising from claims, assessments, litigation, fines, and penalties and other sources are recorded when it is probable that a liability has been incurred and the amount can be reasonably estimated. Legal costs incurred in connection with loss contingencies are expensed as incurred.
| (s) | Significant Risks and Uncertainties Including Business and Credit Concentrations |
The Company’s principal operations are the research, design, and implementation of the Aurora Driver. The Company is currently researching and developing its proprietary technology with the goal of
| F-49 |
commercializing the Aurora Driver. The Company expects that it will need to raise additional capital to support its development and commercialization activities. Significant risks and uncertainties to the Company’s operations include failing to secure additional funding and the threat of other companies developing and bringing to market similar technology at an earlier time than the Company.
Financial instruments that potentially subject the Company to concentration of credit risk consist primarily of cash and cash equivalents. The Company maintains its cash and cash equivalents at U.S. commercial banks. Cash and cash equivalents deposited with domestic commercial banks generally exceed the Federal Deposit Insurance Corporation insurable limit. To date, the Company has not experienced any losses on its deposits of cash and cash equivalents.
The Company typically invests in U.S. Treasury securities and classifies its short-term investments as In general, these investments are free of trading restrictions. The Company carries these at fair value, based on quoted market prices or other readily available market information and recognizes gains and losses when realized.
available-for-sale.
In 2019, the Company reported $19,601 in revenue from automotive original equipment manufacturers (OEM), three of which (Customer A, B, and C) qualified as major customers. Major customers are defined as those generating revenue which exceeds 10% of the Company’s annual revenue. Revenue from Customer A, B, and C accounted for 67 %, 18 % and 15 % of revenue in 2019, respectively. Each commercial relationship with an OEM customer was governed by a master services agreement (sometimes called a development or partnership agreement or similar), with periodic statements of work that specify the work that was to occur and payments that were to be made during the term of the statement of work. The revenue arrangements were nonrecurring, and, as of December 31, 2020, the Company does not have any long-term contracts with customers that are expected to provide revenue streams in the short term. However, given the amount of cash, cash equivalents, and restricted cash the Company has it believes its capital resources are sufficient to meet its working capital and capital expenditure needs for at least twelve months following the issuance date of the accompanying financial statements.
On March 11, 2020, the World Health Organization declared the novel strain of coronavirus,
COVID-19,
a global pandemic and recommended containment and mitigation measures worldwide. As of the date of these financial statements, the Company has not experienced a negative impact to its financial position, results of operations, and operating cash flows. The Company cannot accurately predict the length or severity of this pandemic and the impact it might have on the world and domestic economies. However, the Company believes that for the foreseeable future, based on its current capital resources and its operations and cash flows, it will not be materially nor negatively affected. (t) |
Segment Information |
The Company has one reportable segment. The Company’s chief operating decision maker (the “CODM”) manages the operations of the Company on a consolidated basis when allocating resources and all significant operating decisions are based on analysis of the Company as a single business.
(u) |
Reclassifications |
Certain amounts from prior periods have been reclassified to conform to the current period presentation.
(v) |
Recently Issued Accounting Standards – Not Yet Adopted |
In June 2016, the FASB issued ASU , that replaces the incurred loss impairment
2016-13,
Financial Instruments—Credit Losses (Topic 326): Measurement of Credit Losses on Financial Instruments
| F-50 |
methodology in current GAAP. The new impairment model requires immediate recognition of estimated credit losses expected to occur for most financial assets and certain other instruments. Entities will apply the standard’s provisions as a cumulative-effect adjustment to retained earnings as of the beginning of the first effective reporting period. The standard will be effective for the Company on January 1, 2021. The Company is currently evaluating the impact of the new guidance.
In August 2018, the FASB issued
ASU No. 2018-15,
Intangibles—Goodwill and
Other-Internal-Use
Software(Subtopic 350-40):
Customer’s Accounting for Implementation Costs Incurred in a Cloud Computing Arrangement That Is a Service Contract, which aligns the requirements for capitalizing implementation costs incurred in a hosting arrangement that is a service contract with the requirements for capitalizing implementation costs incurred to develop or obtain internal-use
software. The new standard requires capitalized costs to be amortized on a straight-line basis generally over the term of the arrangement, and the financial statement presentation for these capitalized costs would be the same as that of the fees related to the hosting arrangements. The standard will be effective for the Company on January 1, 2021 and will be applied prospectively. The adoption is not expected to have a material impact on the financial statements. In December 2019, the FASB issued ASU , which simplifies accounting for income taxes by revising or clarifying existing guidance in ASC 740, Income Taxes, as well as removing certain exceptions within ASC 740. The new standard is effective for annual periods beginning after December 15, 2021 and earlier adoption permitted. The Company is evaluating the timing and impact of its pending adoption of this standard on the financial statements.
2019-12,
Simplifying the Accounting for Income Taxes
(w) |
Recently Issued Accounting Standards – Adopted in Fiscal 2020 |
In August 2018, the FASB issued ASU , which amends ASC 820, Fair Value Measurement. The standard no longer requires disclosure of the amount and reasons for transfers between Level 1 and Level 2 of the fair value hierarchy, but public companies will be required to disclose the range and weighted-average used to develop significant unobservable inputs for Level 3 fair value measurements. The Company adopted the standard effective January 1, 2020. The adoption did not have a material impact on the financial statements.
2018-13,
Disclosure Framework - Changes to the Disclosure Requirements for Fair Value Measurement
(3) |
Balance Sheet Detail |
| (a) | Short-term Investments |
All short-term investments as of December 31, 2019 matured in 2020 and funds were reinvested in highly liquid investments classified as cash equivalents. During fiscal 2020 and 2019, there were no realized gains or losses from sales of marketable securities and there were no reclassifications out of accumulated other comprehensive income into investment income.
The amortized costs, unrealized gains and estimated fair values of the Company’s short-term investments as of December 31, 2019 were as follows
Amortized Cost |
Gross Unrealized Gains |
Fair Value |
||||||||||
| U.S. government securities |
$ | $ | $ | |||||||||
| |
|
|
|
|
|
|||||||
| Total short-term investments |
$ | $ | $ | |||||||||
| |
|
|
|
|
|
|||||||
| F-51 |
All securities had stated effective maturities of one year or less.
| (b) | Fair Value of Financial Instruments |
The Company uses a three-level hierarchy, which prioritizes, within the measurement of fair value, the use of market-based information over entity-specific information for fair value measurement based on the nature of inputs used in the valuation of an asset or liability as of the measurement date. Fair value focuses on an exit price and is defined as the price that would be received to sell an asset or paid to transfer a liability in an orderly transaction between market participants at the measurement date. The inputs or methodology used for valuing financial instruments are not necessarily an indication of the risk associated with those financial instruments.
The three-level hierarchy for fair value measurements is defined as follows:
Level
1:
Level
2:
Level
3:
An asset or liability’s categorization within the valuation hierarchy is based upon the lowest level of input that is significant to the fair value measurement.
The following table summarizes the Company’s fair value hierarchy for its financial assets measured at fair value on a recurring bases as of December 31, 2020 and 2019:
As of December 31, 2020 |
||||||||||||||||
Level 1 |
Level 2 |
Level 3 |
Total |
|||||||||||||
| Cash equivalents: |
||||||||||||||||
| Money market funds |
$ | $ | — | $ | — | $ | ||||||||||
| U.S. government securities |
|
— | — |
|
||||||||||||
| |
|
|
|
|
|
|
|
|||||||||
| Total cash equivalents |
$ | $ | — | $ | — | $ | ||||||||||
| |
|
|
|
|
|
|
|
|||||||||
As of December 31, 2019 |
||||||||||||||||
Level 1 |
Level 2 |
Level 3 |
Total |
|||||||||||||
| Cash equivalents: |
||||||||||||||||
| Money market funds |
$ | $ |
|
$ | — | $ | ||||||||||
| U.S. government securities |
|
— | ||||||||||||||
| |
|
|
|
|
|
|
|
|||||||||
| Total cash equivalents |
$ | $ | $ | — | $ | |||||||||||
| |
|
|
|
|
|
|
|
|||||||||
| Short-term investments: |
||||||||||||||||
| U.S. government securities |
— | — | ||||||||||||||
| |
|
|
|
|
|
|
|
|||||||||
| Total short-term investments |
$ | — | $ | $ | — | $ | ||||||||||
| |
|
|
|
|
|
|
|
|||||||||
The Company’s marketable security investments are carried at fair value under the Level 1 and 2 valuation hierarchy based on quoted prices in an active market.
| F-52 |
| (c) | Property and Equipment |
Property and equipment consist of the following at December 31:
2020 |
2019 |
|||||||
| Furniture and fixtures |
$ | $ | ||||||
| Test and lab equipment |
||||||||
| Leasehold improvements |
||||||||
| Computers and equipment |
||||||||
| Computer software |
||||||||
| Automobile |
||||||||
| |
|
|
|
|||||
| Less accumulated depreciation and amortization |
( |
) | ( |
) | ||||
| |
|
|
|
|||||
| Total property and equipment, net |
$ | $ | ||||||
| |
|
|
|
|||||
| (d) | Other Assets |
Other assets consist of the following at December 31:
2020 |
2019 |
|||||||
| Long-term prepaid expenses and other assets |
$ | $ | ||||||
| Security deposits |
||||||||
| |
|
|
|
|||||
| Total other assets |
$ | $ | ||||||
| |
|
|
|
|||||
| (e) | Accrued Expenses and Other Current Liabilities |
Accrued expenses and other current liabilities consist of the following at December 31:
2020 |
2019 |
|||||||
| Accrued expenses |
$ | $ | ||||||
| Accrued compensation |
||||||||
| Other |
||||||||
| |
|
|
|
|||||
| Total accrued expenses and other current liabilities |
$ | $ | ||||||
| |
|
|
|
|||||
(4) |
Development Services Revenue |
The Company derived its revenue from nonrecurring development service agreements to research, design, and implement the Aurora Driver. The agreements are negotiated with billing schedules that align with the delivery of performance obligations, and customers are invoiced with net The Company’s customer agreements include multiple performance obligations, which include customer hardware design and development services, and other services.
30-to
60-day
payment terms.Custom hardware design and development services often involve supplying a hardware reference design to the customer, which provides for various technical specifications for operating a customer’s vehicle platform with the Aurora Driver. Development services are recognized over time as the Company performs the underlying services and satisfies the performance obligations. Revenue allocable to hardware design and development services are recognized over time based on the hours incurred.
| F-53 |
(a) |
Significant Judgments |
I
n the Company’s contract with Customer A, the Company provided a commercialization credit, which provided the customer with the option to receive a credit of a certain amount under the contract, when and if the customer launches vehicles integrated with the Company’s Aurora Driver. The Company had accounted for the commercialization credit as a material right, and significant judgment was required to determine the stand-alone selling price of the performance obligation. The Company performed a valuation of the stand-alone selling price, using a Black-Scholes-Merton option pricing model, which estimated the likelihood that the customer would exercise its option. In 2019 the option to receive the credit under the contract expired and as such the resulting credit was recognized in 2019. | (b) | Contract Assets |
Contract assets relate to the Company’s right to consideration for performance obligations satisfied but not billed at the reporting date. As of December 31, 2020 and 2019, the Company did no
| (c) | Deferred Revenue |
Deferred revenue consists primarily of amounts that have been invoiced, and for which the Company has the right to bill, in advance of performance obligations being satisfied and revenue being recognized under contracts with customers. Deferred revenue associated with performance obligations that are anticipated to be satisfied during the succeeding 12 months is recorded as current deferred revenue, and the remaining portion is recorded as noncurrent deferred revenue in the Company’s balance sheet. The Company had no
| (d) | Costs to Obtain and Fulfill a Contract |
The Company did no
(5) |
Acquisitions |
Blackmore Sensors and Analytics, Inc.
On August 26, 2019, the Company acquired 100 % of the voting interests in Blackmore Sensors and Analytics, Inc. (“Blackmore”) which was developing light detection and ranging radar. The Company has included the financial results of Blackmore in the consolidated financial statements prospectively from the date of acquisition. The transaction costs associated with the acquisition were approximately $1,676 and were recorded in general and administrative expense in 2019. The acquisition date fair value of the consideration transferred for Blackmore was approximately $74,712 , which consisted of the following:
Fair Value |
||||
| Cash |
$ | |
||
| Stock Consideration |
||||
| Assumed liabilities related to third-party expenses |
||||
| |
|
|||
| Total |
$ | |||
| |
|
|||
As part of the acquisition, the Company assumed certain Blackmore compensation agreements, including the conversion of certain shares of Blackmore restricted stock into rights to receive the Company’s restricted stock, and assuming certain stock options with an estimated fair value of $1,537 . For the stock
| F-54 |
options assumed, based on the service period related to the period prior to the acquisition date, $692 was allocated to the purchase price, and $845 relating to post-acquisition services which will be recorded as operating expenses over the remaining requisite service periods. The stock consideration transferred comprised 2,300,690 shares of the Company’s Series B preferred stock, 2,557,518 shares of the Company’s Series 1,835,678 shares of the Company’s common stock. The preferred stock and restricted stock awards (RSAs) were valued based on the August 26, 2019 fair value, as determined by a third party valuation expert using an Option Pricing Method model, and the estimated fair value of the stock options assumed by the Company was determined using the Black-Scholes option pricing model. The RSAs vest monthly over a
4 -year period starting on the vesting commencement date and expire once the holder ceases to be a service provider of the Company. The weighted average vesting term for these RSAs was 1.1 years.
B-1
preferred stock, and The Company has accounted for this acquisition as a business combination, and therefore the assets acquired and liabilities assumed were recognized at their fair values on the date of acquisition. The following table summarizes the fair values of assets acquired and liabilities assumed as of the date of acquisition:
Fair Value |
||||
| Cash and cash equivalents |
$ | |||
| Prepaid expenses and other current assets |
||||
| Goodwill |
||||
| Intangible assets |
||||
| Fixed assets, net |
||||
| Right-of-use |
||||
| Accrued payroll and related liabilities |
( |
) | ||
| Accounts payable and accrued liabilities |
( |
) | ||
| Deferred tax liability |
( |
) | ||
| Operating lease liabilities |
( |
) | ||
| |
|
|||
| Total |
$ | |||
| |
|
|||
The excess of purchase consideration over the fair value of net tangible and identifiable intangible assets acquired was recorded as goodwill, which is primarily attributed to the assembled workforce, and is not deductible for tax purposes. The fair values assigned to tangible assets acquired and liabilities assumed are based on management’s estimates and assumptions.
The sole identifiable intangible asset acquired in the Blackmore acquisition was
in-process
research and development (IPR&D) and has an indefinite useful life as of the date of the acquisition. The fair value of the IPR&D intangible asset was determined through a replacement cost approach, which identifies the costs that would be necessary to recreate the asset if the Company were to internally develop the acquired technology. The asset has not been placed into service and there have been no impairment charges related to the intangible asset as of December 31, 2020.
(6) |
Capital Stock |
| (a) | Common Stock |
The Company is authorized to issue 333,000,000 0.0001 128,434,407 121,414,834 one vote per share
| F-55 |
| (b) | Redeemable Convertible Preferred Stock |
The Company is authorized to issue 140,425,920 0.0001 20,177,530 9,653,930 29,948,750 78,065,640 2,580,070
B-1.
At December 31, 2020, the Company had 20,177,530 9,653,930 29,948,750 71,389,540 2,557,518
B-1
issued and outstanding. (i) |
Dividends |
The holders of Seed 1, Seed 2, Series A, and Series B (collectively, the “Senior Preferred Stock”) are entitled to receive dividends, when, as and if declared by the board of directors of the Company, out of any available assets of the Company. The annual dividend rate is $0.014 per share per annum for Seed 1, $0.026 per share per annum for Seed 2, $0.222 per share per annum for Series A, and $0.739 per share per annum for Series B (subject to adjustment from time to time for recapitalization with respect to each such series of preferred stock). The right to receive dividends on shares of Senior Preferred Stock is not cumulative, and payment of any dividends to the holders of Senior Preferred Stock is on a pro rata pari passu basis in proportion to the dividend rates for each series of Senior Preferred Stock.
Subject to the prior dividend rights of the Senior Preferred Stock, the holders of outstanding shares of Series 0.739 per share per annum for Series
B-1
shall be entitled to receive dividends, when, as and if declared by the board of directors of the Company, out of any available assets of the Company. The annual dividend rate is $B-1
(subject to adjustment from time to time for recapitalization with respect to each such series of redeemable convertible preferred stock). The right to receive dividends on shares of Series B-1
shall not be cumulative and payment of any dividends to the holders of Series B-1
shall be on a pro rata pari passu basis in proportion to the dividend rates for Series B-1.
After dividends in the full preferential amounts specified for the preferred stock have been paid or set aside, any additional dividends shall be paid among the holders of the redeemable convertible preferred stock and common stock in proportion to the greatest whole number of shares of common stock, which would be held by each holder if all shares of redeemable convertible preferred stock were converted at the then effective conversion rate. The Company has no
(ii) |
Conversion |
At the option of the holder, each share of redeemable convertible preferred stock shall be convertible, at any time after the date of issuance of such share, into the number of shares of common stock determined by dividing the original issue price for the redeemable convertible preferred stock by the applicable conversion price, determined at the time of conversion. The original issue price and the conversion price will be adjusted for any stock dividends, stock splits, combination of shares, reorganizations, recapitalizations, reclassifications, or other similar events. The conversion price of each series of redeemable convertible preferred stock is also subject to broad-based weighted average anti-dilution adjustments in the event that the Company issues certain securities at a price per share less than the then applicable conversion price of such series of redeemable convertible preferred stock.
Each share of redeemable convertible preferred stock will automatically be converted into common stock at the then effective conversion rate (i) immediately prior to the closing of a firm commitment underwritten initial public offering of common stock under the Securities Act of
| F-56 |
1933, as amended, provided that the aggregate gross proceeds to the Company are not less than $100,000 or (ii) upon the written consent for such conversion from (A) the holders of a majority of the outstanding redeemable convertible preferred stock (voting together as a single class and on an
as-converted
basis) outstanding and (B) the holders of a majority off outstanding of Series B (voting as a separate class) outstanding. (iii) |
Liquidation |
In the event of any liquidation, dissolution, or winding up of the Company, the holders of then outstanding Senior Preferred Stock are entitled to be paid on a pari passu basis, and prior and in preference to any distribution on any share of Series 0.175 for Seed 1, $0.322 for Seed 2, $2.776 for Series A, and $9.240 for series B) and (ii) all declared but unpaid dividends on such share of Senior Preferred Stock or (b) the amount that would have been payable if such share of Senior Preferred Stock had converted to common stock immediately prior to such liquidation, dissolution or winding up, or (2) with respect to a particular series of Senior Preferred Stock, such lesser amount as may be approved by the holders of a majority of the outstanding shares of such series, voting as a separate series.
B-1
and common stock, an amount per share equal to (1) the greater of (a) the sum of (i) the liquidation preference specified for such share of Senior Preferred Stock ($Subject to the prior liquidation rights of the Senior Preferred Stock, in the event of any liquidation, dissolution, or winding up of the Company, the holders of the then outstanding Series 9.240 ) and (ii) all declared but unpaid dividends on such share of Series
B-1,
are entitled to be paid on a pari passu basis, and prior and in preference to any distribution on any share of common stock, an amount per share equal to (1) the greater of (a) the sum of (i) the liquidation preference specified for such share of Series B-1
(currently $B-1
or (b) the amount that would have been if such shares of series B-1
had converted to common stock immediately prior to such liquidation, dissolution or winding up, or (2) such lesser amount as may be approved by the holders of a majority of the outstanding shares of Series B-1,
voting as a separate series. After the payment of the full liquidation preference to the holders of preferred stock described above, the assets of the Company legally available for distribution, if any, shall be distributed pro rata to holders of the common stock of the Company in proportion to the number of shares of common stock held by them.
The liquidation preferences are deemed to be contingent redemption features exercisable on certain deemed liquidation events which includes a merger, change of control, or a sale of substantially all of the Company’s assets. The deemed liquidation event would constitute a redemption event not solely within the control of the Company. Redeemable convertible preferred stock is presented outside of permanent equity in mezzanine equity on the balance sheets. It is not probable that the Preferred Stock will become redeemable as of December 31, 2020.
(iv) |
Voting |
The holders of shares of redeemable convertible preferred stock are entitled to the number of votes equal to the number of shares of common stock into which the shares are then convertible. As long as any shares of Seed 1 remain outstanding, the holders of Seed 1, voting as a separate class, are entitled to elect one member of the board of directors (the Series Seed Director). As long as any shares of Series B preferred stock remain outstanding, the holders of Series B preferred stock, voting as a separate class, are entitled to elect one member of the board of directors. The holders of common stock, voting as a separate class, are entitled to elect five members of the board of directors. Any additional members of the board of directors shall be elected by the holders of common stock and redeemable convertible preferred stock.
| F-57 |
So long as the holders of Seed 1 are entitled to elect a director, the Series Seed Director shall be entitled to cast two votes on all matters that come before the board of directors. All remaining directors shall be entitled to cast one vote on all matters.
(v) |
Protective Provision |
As long as any shares of redeemable convertible preferred stock are issued and outstanding, the holders of a majority of outstanding shares of redeemable convertible preferred stock, voting together as a single class on an 250,000 (subject to limited exceptions); and creating or holding capital stock in a subsidiary that is not wholly owned.
as-converted
basis, must approve certain transactions. Such actions include adversely amending the rights, preferences, privileges, or restrictions of preferred stock; purchasing, redeeming, paying, or declaring any dividend or making any distribution on any shares of capital stock (subject to limited exceptions); and creating or authorizing the issuance of any debt security or other indebtedness for borrowed money in excess of $(7) |
Stock Option Plan |
2017 Equity Incentive Plan
In 2017, the Company adopted the 2017 Equity Incentive Plan (the Plan). Under the Plan, restricted stock awards, incentive stock options, and nonqualified stock options for the purchase of 50,495,331 shares of common stock may be granted to employees, officers, directors, consultants, and others.
Stock options under the Plan may be outstanding for periods of up to 10 years following the grant date. The exercise price of stock options for the purchase of shares of common stock under the Plan may not be less than 100 % of the fair value of the Company’s common stock on the date of the grant, as determined by the board of directors. In the case of an incentive stock option granted to an employee who owns stock representing more than 10 % of the voting shares, the price of each share will be at least 110 % of the fair value on the date of grant. Stock options generally vest over 4 years starting on the vesting commencement date (with a
10 years from the date of grant or, if earlier, 3 months after the option holder ceases to be a service provider of the Company. Stock options granted to a stockholder that owns greater than 10 % of the company expire, if not exercised, 5 years from the date of grant.
one-year
cliff) and expire, if not exercised, The Company allows certain option holders to exercise unvested options. Exercises of unvested options do not affect the equity classification of the Plan. Shares issued pursuant to such early exercises are subject to a right of repurchase at the original issuance price. The Company’s repurchase right with respect to those shares lapses over the vesting period. As of December 31, 2020 and 2019, the Company recorded $619 and $1,279 in early exercise liability.
The fair value of each award granted to employees in 2020 and 2019 has been estimated on the date of grant using the Black-Scholes-Merton option pricing model with the following weighted average assumptions: expected life of 5.93 years and 6.08 years, risk-free interest rate of 0.87 % and 2.02 %; expected volatility of 55.00 % and 55.00 %; and no
| F-58 |
Stock-based compensation is allocated on a departmental basis, based on the classification of the option holder or grant recipient. No no 16,569 and $10,764 in 2020 and 2019, respectively. The unrecognized deferred compensation expense for future years’ compensation expense related to unvested options was approximately $33,303 and $43,437 , respectively, at December 31, 2020 and 2019. Unrecognized deferred compensation will be recognized over an estimated weighted average amortization period of approximately 2.51
In April 2019 the Company facilitated a third-party tender offer (the (“Secondary Transaction”) to provide certain existing investors (the “Participating Investors”) with an opportunity to purchase additional shares of common stock from certain employees of the Company at an agreed upon purchase price. Eligible employees were given the option to sell 10 % of their vested shares (whether such shares were held by the employees prior to the tender offer or purchased pursuant to option exercises in connection with the tender offer). A total of 3,607,380 shares were sold to the Participating Investors in the Secondary Transaction, 121,610 of which were tendered pursuant to the exercise of vested stock options. The Company recognized $17,257 in stock-based compensation in relation to the Secondary Transaction.
Stock option activity under the Plan is as follows:
Options outstanding |
||||||||||||
|
Options available |
Number of shares |
Weighted average exercise price |
||||||||||
| Balance, December 31, 2018 |
$ | |||||||||||
| Authorized |
— | — | ||||||||||
| Granted |
( |
) | ||||||||||
| Exercised |
— | ( |
) | |||||||||
| Early exercise repurchase |
— | |||||||||||
| Forfeited |
( |
) | ||||||||||
| |
|
|
|
|||||||||
| Balance, December 31, 2019 |
$ | |||||||||||
| |
|
|
|
|||||||||
| Authorized |
— | — | — | |||||||||
| Granted |
( |
) | ||||||||||
| Exercised |
— | ( |
) | |||||||||
| Early exercise repurchase |
— | |||||||||||
| Forfeited |
( |
) | ||||||||||
| |
|
|
|
|||||||||
| Balance, December 31, 2020 |
$ | |||||||||||
| |
|
|
|
|||||||||
The Company uses the fair value method to value options granted to nonemployees. There was no stock-based compensation in connection with grants of options to nonemployees in 2020 and 2019. As of December 31, 2020 and 2019, there is no future stock-based compensation for unvested non employee options granted and outstanding.
2016 Blackmore Sensors & Analytics, Inc. Equity Incentive Plan
As part of the acquisition of Blackmore, the Company assumed stock options (the Assumed Options) under Blackmore’s 2016 Equity Incentive Plan (the Blackmore Plan) to the extent such securities were held by people who continued as employees of the Company. As of the acquisition date, up to 581,730 shares of the Company’s common stock could have been issued pursuant to the exercise of Assumed Options. The Company may not grant any new awards under the Blackmore Plan. Forfeited options are not returned to the plan.
| F-59 |
The Assumed Options may be outstanding for periods of up to 10 years following the original Blackmore grant date. The Assumed Options generally vest over 4 years from the original vesting commencement date (with a 10 years from the date of grant or, if earlier, 3 months after the option holder ceases to be a service provider of the Company.
one-year
cliff) and expire, if not exercised, The fair value of each award granted to employees was estimated on the date of grant using the Black-Scholes-Merton option pricing model with the following weighted average assumptions: expected life of 2.39 years, risk-free interest rate of
Stock-based compensation is allocated on a departmental basis, based on the classification of the option holder or grant recipient. No 311 and $122 in 2020 and 2019, respectively. The unrecognized deferred compensation expense for future years’ compensation expense related to unvested options was approximately $327 at December 31, 2020. Unrecognized deferred compensation will be recognized over an estimated weighted average amortization period of approximately 1.14 years.
Options outstanding |
||||||||||||
Options available |
Number of shares |
Weighted average exercise price |
||||||||||
| Balance, August 26, 2019 |
— | $ | ||||||||||
| Authorized |
— | — | — | |||||||||
| Granted |
— | — | — | |||||||||
| Exercised |
— | ( |
) | |||||||||
| Forfeited |
— | ( |
) | |||||||||
| |
|
|
|
|||||||||
| Balance, December 31, 2019 |
— | $ | ||||||||||
| |
|
|
|
|||||||||
| Authorized |
— | — | ||||||||||
| Granted |
— | — | ||||||||||
| Exercised |
— | ( |
) | |||||||||
| Forfeited |
— | ( |
) | |||||||||
| |
|
|
|
|||||||||
| Balance, December 31, 2020 |
— | $ | ||||||||||
| |
|
|
|
|||||||||
(8) |
Income Taxes |
The Company only has operations in the United States. Loss from operations before income taxes is categorized geographically as follows:
2020 |
2019 |
|||||||
| United States |
$ | ( |
) | $ | ( |
) | ||
| |
|
|
|
|||||
| Total loss from operations before income taxes |
$ | ( |
) | $ | ( |
) | ||
| |
|
|
|
|||||
| F-60 |
The federal and state income tax provision is summarized as follows:
2020 |
2019 |
|||||||
| Current income tax expense: |
||||||||
| Federal |
$ | — | $ | — | ||||
| State |
||||||||
| |
|
|
|
|||||
| Total current income tax expense |
||||||||
| |
|
|
|
|||||
| Deferred income tax benefit: |
||||||||
| Federal |
— | ( |
) | |||||
| State |
— | ( |
) | |||||
| |
|
|
|
|||||
| Total deferred income tax benefit |
— | ( |
) | |||||
| |
|
|
|
|||||
| Total tax benefit (expense) |
$ | $ | ( |
) | ||||
| |
|
|
|
|||||
The effective tax rate of the Company’s provision for income taxes differs from the federal statutory rate as follows:
2020 |
2019 |
|||||||
| Tax at federal statutory rate |
% | % | ||||||
| State income tax, net of federal tax benefit |
|
|||||||
| Stock-based compensation |
( |
) | ( |
) | ||||
| Research and development credits |
||||||||
| Other |
( |
) | ||||||
| Change in valuation allowance |
( |
) | ( |
) | ||||
| |
|
|
|
|||||
| Total provision for income taxes |
|
% | % | |||||
| |
|
|
|
|||||
The tax effects of significant items comprising the Company’s deferred taxes are as follows:
2020 |
2019 |
|||||||
| Deferred tax assets: |
||||||||
| Net operating losses |
$ | $ | ||||||
| Tax credits |
||||||||
| Stock-based compensation |
|
|||||||
| Accrued compensation and related expenses |
||||||||
| Lease liability |
||||||||
| Other |
||||||||
| |
|
|
|
|||||
| Total deferred tax assets |
||||||||
| Valuation allowance |
( |
) | ( |
) | ||||
| |
|
|
|
|||||
| Total deferred tax assets, net of valuation allowance |
||||||||
| Deferred tax liabilities: |
||||||||
| Depreciation and amortization |
( |
) | ( |
) | ||||
| Right of use asset |
( |
) | ( |
) | ||||
| Other |
( |
) | ( |
) | ||||
| |
|
|
|
|||||
| Total deferred tax liabilities |
( |
) | ( |
) | ||||
| |
|
|
|
|||||
| Total net deferred tax assets |
$ | ( |
) | $ | ( |
) | ||
| |
|
|
|
|||||
F-61 |
As of December 31, 2020, the Company had federal and state net operating losses of $298,616 and $105,029 , respectively. If not utilized, the federal and state net operating loss carryforwards will both begin to expire starting in 2037
As of December 31, 2020, the Company had federal research and development credits of $17,760 , which will begin to expire in 2037 and state research and development credits of $9,028 , which will begin to expire in 2032 .
Assessing the realizability of the Company’s deferred tax assets is dependent upon several factors, including the likelihood and amount, if any, of future taxable income in relevant jurisdictions during the periods in which those temporary differences become deductible. The Company has evaluated the criteria for realization of deferred tax assets and, as a result, has determined that certain deferred tax assets are not realizable on a more likely than not basis. Accordingly, the Company recorded a valuation allowance of $87,241 and $30,525 respectively, as of December 31, 2020 and 2019.
Internal Revenue Code Section 382 and similar state provisions limit the use of net operating losses and tax credit carryforwards in certain situations where changes occur in the stock ownership of a company. In the event the Company has a change of ownership, utilization of net operating losses and tax credit carryforwards may be limited. Certain acquired net operating losses and tax credits are subject to limitations.
The Company recorded cumulative unrecognized tax benefits pursuant to 5,256 and $2,360 , respectively, during the years ended December 31, 2020 and 2019.
ASC Subtopic 740-30
in the amount of $The Company’s policy is to recognize interest and penalties related to unrecognized tax benefits within the provision for income taxes. Amounts accrued for interest and penalties were not significant during the years ended December 31, 2020 and 2019.
Changes in balances during 2020 and 2019 and ending balances as of December 31, 2020 and 2019 in gross unrecognized tax benefits were as follows:
2020 |
2019 |
|||||||
| Beginning balance |
$ | |
$ | |||||
| Increases related to tax positions taken during a prior year |
||||||||
| Increases related to tax positions taken during the current year |
||||||||
| Decreases related to tax positions taken during a prior year |
( |
) | ( |
) | ||||
| Decreases related to tax settlements with taxing authorities |
|
|
||||||
| |
|
|
|
|||||
| Ending balance |
$ | $ | ||||||
| |
|
|
|
|||||
The Company does not anticipate that the amount of existing unrecognized tax benefits will significantly increase or decrease within the next 12 months. None of the unrecognized tax benefits, if recognized, would have a material effect on the effective tax rate.
| F-62 |
(9) |
Leases |
The Company leases its office facilities in Palo Alto, California; Mountain View, California; San Francisco, California; Pittsburgh, Pennsylvania; Bozeman, Montana; and Coppell, Texas, under non cancelable operating lease agreements that expire between 2021 through 2030.
As of December 31, 2020, the Company’s operating leases had a weighted average remaining lease term of 9.2 years and a weighted average discount rate of 6.85 %. One of the Company’s leases contained an early termination agreement that allowed the Company to early terminate the lease by providing to the landlord a cancellation notice and termination fee. The Company elected to exercise the early termination option in 2020 and included the termination fee in the calculation of the lease’s ROU asset and lease liability .
Future minimum payments under non cancelable operating leases (with initial or remaining lease terms in excess of one year) and other contractual commitments as of December 31, 2020 were as follows:
|
Operating leases |
||||
| Year ending December 31, |
||||
| 2021 |
$ | |||
| 2022 |
||||
| 2023 |
||||
| 2024 |
||||
| 2025 |
||||
| Thereafter |
||||
| |
|
|||
| Total |
$ | |
||
| |
|
|||
Rent expense under operating leases was $14,109 and $4,487 , respectively, in 2020 and 2019.
As of December 31, 2020, the Company recorded $15,312 in other current assets related to variable payments to construct landlord owned assets. These payments are treated as variable payments as the total amount to be paid for these assets was unknown at the lease commencement date and are expected to be known once the project is completed in 2021.
(10) |
Commitments and Contingencies |
From time to time the Company may be party to various claims in the normal course of business. Legal fees and other costs associated with such actions are expensed as incurred. The Company assesses the need to record a liability for litigation and loss contingencies. Reserve estimates are recorded when and if it is determined that a loss related to certain matters is both probable and reasonably estimable. No
Future minimum payments for contractual commitments related to purchase obligations as of December 31, 2020 were as follows:
Purchase obligation |
||||
| Year ending December 31, |
||||
| 2021 |
$ | |
||
| 2022 |
||||
| 2023 |
||||
| 2024 |
|
|||
| 2025 |
|
|||
| Thereafter |
|
|||
| |
|
|||
| Total |
$ | |||
| |
|
|||
| F-63 |
(11) |
Employee Benefit Plan |
The Company sponsors the Aurora 401(k) plan. All employees are eligible to participate in the plans after meeting eligibility requirements. Participants may elect to have a portion of their salary deferred and contributed to the plan up to the limit allowed by applicable income tax regulations. The Company may make a matching contribution at the discretion of the board of directors. The Company recognized $0 and $100 in 2020 and 2019, respectively, in matching contributions.
(12) |
Supplemental Cash Flow Information |
Cash paid for income taxes was $7 and $2 in 2020 and 2019, respectively. Cash paid for interest and noncash investing and financing activities were as follows:
2020 |
2019 |
|||||||
| Noncash investing and financing activities: |
||||||||
| Property and equipment included in accounts payable |
$ | $ | ||||||
| Vesting of early exercised stock options |
||||||||
| Non-cash acquisition |
|
( |
) | |||||
| Cash, cash equivalents, and restricted cash at end of year: |
||||||||
| Cash and cash equivalents |
$ | |
$ | |||||
| Restricted cash |
||||||||
| |
|
|
|
|||||
| Total cash, cash equivalents, and restricted cash |
$ | $ | ||||||
(13) |
Earnings Per Share |
Series Seed 1 preferred stock, Series Seed 2 preferred stock, Series A preferred stock, Series B preferred stock, Series
B-1
preferred stock, unvested Restricted Stock Awards (“RSA”), and unvested early exercised stock options are participating securities in periods of income as the securities participate in undistributed earnings. The securities do not share in losses. The Company computes earnings per share of common stock using the
two-class
method required for participating securities and does not apply the two-class
method in periods of net loss. Basic earnings per share is computed using the The computation of basic and diluted earnings per share is the same as the inclusion of all potential common stock would have been anti-dilutive in a period of net loss.
two-class
method required for participating securities but is not applied in fiscal periods with a net loss. 2020 |
2019 |
|||||||
| Numerator: |
||||||||
| Net Loss |
$ | ( |
) | $ | ( |
) | ||
| Net loss per share: |
||||||||
| Basic |
$ | ( |
) | $ | ( |
) | ||
| Diluted |
$ | ( |
) | $ | ( |
) | ||
| Denominator: |
||||||||
| Weighted average common shares outstanding - Basic |
||||||||
| Weighted average common shares outstanding - Diluted |
||||||||
| F-64 |
The following table presents the potential common stock outstanding excluded from the computation of diluted loss per share because including them would have had an antidilutive effect:
2020 |
2019 |
|||||||
| Seed 1 Convertible Preferred Stock |
||||||||
| Seed 2 Convertible Preferred Stock |
||||||||
| Series A Convertible Preferred Stock |
||||||||
| Series B Convertible Preferred Stock |
||||||||
| Series B-1 Convertible Preferred Stock |
||||||||
| Options |
||||||||
| Restricted Stock |
||||||||
| |
|
|
|
|||||
| Total |
||||||||
(14) |
Subsequent Events |
On January 19, 2021, the Company was renamed Aurora Innovation OpCo, Inc. and became a fully owned subsidiary of a newly formed Delaware corporation that was renamed Aurora Innovation, Inc. This entity acquired 100 % of the voting interests of Apparate USA LLC (“Uber Advanced Technologies Group” or “ATG”) which was a company developing self-driving technology. Aurora Innovation, Inc., issued 50,873,075 shares of Series 116,173,646 shares of common stock to the common stockholders as part of the acquisition. The Company was also contractually obligated to grant 16,096,348 Restricted Stock Units (RSUs) to former employees of ATG subsequent to the close or, if not granted within 12 months following the closing, to issue an equivalent number of reserved and ungranted shares of Common Stock to Neben Holdings, LLC (“Uber”). The initial purchase accounting for this transaction has not yet been completed due to the timing of the transaction.
U-1
preferred stock to the preferred stockholders of Apparate USA LLC and On January 19, 2021, Uber purchased 20,349,230 shares of Aurora Innovation, Inc. Series 19.66 per share.
U-2
Preferred Stock for $In January 2021, the Company paid $10,000 relating to financial advisory fees with a related party for a contract that was entered into by the Company in December 2020. No amounts were due as of December 31, 2020.
On February 1, 2021, the Board of Directors authorized a 26,394,061
On February 1, 2021, the Company granted 8,574,900 stock options and 14,716,686 RSUs under the 2017 Equity Incentive Plan.
On March 5, 2021, the Company acquired 100 % of the voting interests in OURS Technology Inc (“OURS”), a company that develops Frequency-Modulated Continuous-Wave (FMCW) lidar. The purchase consideration includes $17,750 in cash subject to adjustments and 2,793,699 shares of common stock at a $19.66 per share price. 545,627 options were issued in the Company’s assumption of outstanding equity awards of OURS employees. The initial purchase accounting for this transaction has not yet been completed due to the timing of the transaction.
lidar-on-a-chip
On April 8, 2021, Aurora Innovation OpCo, Inc. was renamed Aurora Operations, Inc.
| F-65 |
AURORA INNOVATION, INC.
Condensed Consolidated Balance Sheets
(in thousands, except share and per share data)
(Unaudited)
June 30, 2021 |
December 31, 2020 |
|||||||
| Assets |
||||||||
| Current assets: |
||||||||
| Cash and cash equivalents |
$ | $ | ||||||
| Restricted cash |
||||||||
| Prepaid expenses and other current assets |
||||||||
| |
|
|
|
|||||
| Total current assets |
||||||||
| Property and equipment, net |
||||||||
| Operating lease right-of-use |
||||||||
| Restricted cash, long-term |
||||||||
| Other assets |
||||||||
| Acquisition related intangible assets |
||||||||
| Goodwill |
||||||||
| |
|
|
|
|||||
| Total assets |
$ | $ | ||||||
| |
|
|
|
|||||
| Liabilities, Redeemable Convertible Preferred Stock, and Stockholders’ Equity (Deficit) |
||||||||
| Current Liabilities |
||||||||
| Accounts payable |
$ | $ | ||||||
| Related party payable |
|
|||||||
| Accrued expenses and other current liabilities |
||||||||
| Operating lease liabilities, current |
||||||||
| |
|
|
|
|||||
| Total current liabilities |
||||||||
| Operating lease liabilities, long-term |
||||||||
| Deferred tax liability |
||||||||
| Deposit liability |
|
|||||||
| Other long-term liabilities |
||||||||
| |
|
|
|
|||||
| Total liabilities |
||||||||
| |
|
|
|
|||||
| Redeemable convertible preferred stock |
||||||||
| Redeemable convertible preferred stock, $ |
||||||||
| Stockholders’ equity (deficit): |
||||||||
| Common stock, $ |
||||||||
| Additional paid-in capital |
||||||||
| Accumulated deficit |
( |
) | ( |
) | ||||
| |
|
|
|
|||||
| Total stockholders’ equity (deficit) |
( |
) | ||||||
| |
|
|
|
|||||
| Total liabilities, redeemable convertible preferred stock, and stockholder’s equity (deficit) |
$ | $ | ||||||
| |
|
|
|
|||||
See accompanying notes to unaudited condensed consolidated financial statements
F-66
AURORA INNOVATION, INC.
Condensed Consolidated Statements of Operations
(in thousands, except share and per share data)
(Unaudited)
Six Months Ended June 30, |
||||||||
2021 |
2020 |
|||||||
| Operating expenses: |
||||||||
| Research and development |
$ | $ | ||||||
| Selling, general and administrative |
||||||||
| |
|
|
|
|||||
| Total operating expenses |
||||||||
| |
|
|
|
|||||
| Loss from operations |
( |
) | ( |
) | ||||
| Other income (expense): |
||||||||
| Interest and other income |
||||||||
| Other expense |
( |
) | ( |
) | ||||
| |
|
|
|
|||||
| Loss before income taxes |
( |
) | ( |
) | ||||
| Income tax benefit |
( |
) |
|
|||||
| |
|
|
|
|||||
| Net loss |
$ | ( |
) | $ | ( |
) | ||
| |
|
|
|
|||||
| Basic and diluted net loss per share |
( |
) | ( |
) | ||||
| |
|
|
|
|||||
| Basic and diluted weighted-average shares outstanding |
||||||||
| |
|
|
|
|||||
See accompanying notes to unaudited condensed consolidated financial statements
F-67
AURORA INNOVATION, INC.
Condensed Consolidated Statements of Comprehensive Loss
(in thousands)
(Unaudited)
Six Months Ended June 30, |
||||||||
2021 |
2020 |
|||||||
| Net Loss |
$ | ( |
) | $ | ( |
) | ||
| Other comprehensive Income: |
||||||||
| Available-for sale investments |
||||||||
| Net unrealized gain |
|
|||||||
| |
|
|
|
|||||
| Net Change |
|
|||||||
| |
|
|
|
|||||
| Other Comprehensive Income (loss) |
|
|||||||
| |
|
|
|
|||||
| Comprehensive Loss |
$ | ( |
) | $ | ( |
) | ||
| |
|
|
|
|||||
See accompanying notes to unaudited condensed consolidated financial statements
F-68
AURORA INNOVATION, INC.
Condensed Consolidated Statements of Redeemable Convertible Preferred Stock and Stockholders’ Equity (Deficit)
(In thousands, except share and per share data)
(Unaudited)
Redeemable Convertible Preferred stock |
Common stock |
Additional paid-in capital
|
Accumulated other comprehensive income |
Accumulated deficit |
Total Stockholders’ Equity (Deficit) |
|||||||||||||||||||||||||||
Shares |
Amount |
Shares |
Amount |
|||||||||||||||||||||||||||||
| Balance as of December 31, 2020 |
$ | $ | $ | $ | — | $ | ( |
) | $ | ( |
) | |||||||||||||||||||||
| |
|
|
|
|
|
|
|
|
|
|
|
|
|
|
|
|||||||||||||||||
| Issuance of Series U-1 redeemable convertible preferred stock at $ |
— | — | — | — | — | — | ||||||||||||||||||||||||||
| Issuance of Series U-2 redeemable convertible preferred stock at $ |
— | — | — | — | — | — | ||||||||||||||||||||||||||
| Issuance of common stock in relation to acquisitions |
— | — | — | — | ||||||||||||||||||||||||||||
| Purchase consideration allocated to non-cash compensation expense |
— | — | — | — | — | — | ||||||||||||||||||||||||||
| Issuance of common stock upon exercise of stock options |
— | — | — | — | — | |||||||||||||||||||||||||||
| Vesting of ear1y exercised stock options |
— | — | — | — | — | |||||||||||||||||||||||||||
| Vesting of restricted stock |
— | — | — | — | — | — | — | |||||||||||||||||||||||||
| Stock-based compensation |
— | — | — | — | — | — | ||||||||||||||||||||||||||
| Net loss |
— | — | — | — | — | — | ( |
) | ( |
) | ||||||||||||||||||||||
| |
|
|
|
|
|
|
|
|
|
|
|
|
|
|
|
|||||||||||||||||
| Balance as of June 30, 2021 |
$ | $ | $ | $ | — | $ | ( |
) | $ | |||||||||||||||||||||||
| |
|
|
|
|
|
|
|
|
|
|
|
|
|
|
|
|||||||||||||||||
See accompanying notes to unaudited condensed consolidated financial statements
F-69
AURORA INNOVATION, INC.
Condensed Consolidated Statements of Redeemable Convertible Preferred Stock and Stockholders’ Equity (Deficit)
(In thousands, except share and per share data)
(Unaudited)
Redeemable Convertible Preferred stock |
Common stock |
Additional paid-in capital
|
Accumulated other comprehensive income |
Accumulated deficit |
Total Stockholders’ Equity (Deficit) |
|||||||||||||||||||||||||||
Shares |
Amount |
Shares |
Amount |
|||||||||||||||||||||||||||||
| Balance as of December 31, 2019 |
$ | $ | $ | $ | $ | ( |
) | $ | ( |
) | ||||||||||||||||||||||
| |
|
|
|
|
|
|
|
|
|
|
|
|
|
|
|
|||||||||||||||||
| Issuance of common stock upon exercise of stock options |
— | — | — | — | — | |||||||||||||||||||||||||||
| Vesting of ear1y exercised stock options |
— | — | — | — | — | |||||||||||||||||||||||||||
| Vesting of restricted stock |
— | — | ( |
) | — | — | — | |||||||||||||||||||||||||
| Stock-based compensation |
— | — | — | — | — | — | ||||||||||||||||||||||||||
| Unrealized gain on held for sale investments |
— | — | — | — | — | — | ||||||||||||||||||||||||||
| Net loss |
— | — | — | — | — | — | ( |
) | ( |
) | ||||||||||||||||||||||
| |
|
|
|
|
|
|
|
|
|
|
|
|
|
|
|
|||||||||||||||||
| Balance as of June 30, 2020 |
$ | $ | $ | $ | $ | ( |
) | $ | ( |
) | ||||||||||||||||||||||
| |
|
|
|
|
|
|
|
|
|
|
|
|
|
|
|
|||||||||||||||||
See accompanying notes to unaudited condensed consolidated financial statements
F-70
AURORA INNOVATION, INC.
Condensed Consolidated Statement of Cash Flows
(In thousands)
(Unaudited)
Six Months Ended June 30, |
||||||||
2021 |
2020 |
|||||||
| Cash flows from operating activities: |
||||||||
| Net loss |
$ | ( |
) | $ | ( |
) | ||
| Adjustments to reconcile net loss to net cash used in operating activities: |
||||||||
| Depreciation, amortization and other |
||||||||
| Reduction in the carrying amount of ROU assets |
||||||||
| Accretion of discount on short-term investments |
|
( |
) | |||||
| Stock based compensation |
||||||||
| Non-cash compensation |
— | |||||||
| Change in deferred tax asset valuation allowance |
( |
) |
|
|||||
| Changes in operating assets and liabilities: |
||||||||
| Prepaid expenses and other current assets |
( |
) | ||||||
| Other assets |
( |
) | ( |
) | ||||
| Accounts payable |
( |
) | ||||||
| Accrued expenses and other current and non-current liabilities |
( |
) | ||||||
| Operating lease liability |
( |
) | ( |
) | ||||
| Deposit liability |
|
|||||||
| |
|
|
|
|||||
| Net cash used in operating activities |
( |
) | ( |
) | ||||
| |
|
|
|
|||||
| Cash flows from investing activities: |
||||||||
| Purchases of property and equipment |
( |
) | ( |
) | ||||
| Net cash acquired in acquisitions |
|
|||||||
| Purchase of short-term investments |
|
( |
) | |||||
| Maturities of short-term investments |
|
|||||||
| |
|
|
|
|||||
| Net cash provided by investing activities |
||||||||
| |
|
|
|
|||||
| Cash flows from financing activities: |
||||||||
| Proceeds from issuance of Series U-2 preferred stock, net |
|
|||||||
| Proceeds from issuance of common stock |
||||||||
| |
|
|
|
|||||
| Net cash provided by financing activities |
||||||||
| |
|
|
|
|||||
| Net increase (decrease) in cash, cash equivalents and restricted cash |
$ | $ | ||||||
| Cash, cash equivalents, and restricted cash at beginning of the period |
||||||||
| |
|
|
|
|||||
| Cash, cash equivalents, and restricted cash at end of the period |
$ | $ | ||||||
| |
|
|
|
|||||
See accompanying notes to unaudited condensed consolidated financial statements
F-71
AURORA INNOVATION, INC.
Notes to Condensed Consolidated Financial Statements (Unaudited)
June 30, 2021
(in thousands, except share and per share data)
(1) |
Overview and Organization and Basis of Presentation |
Overview of the Organization
Aurora Innovation, Inc. (the Company) was initially formed as a Delaware limited liability company in October 2016, then converted to a Delaware corporation in March 2017. The Company has offices in seven cities: Palo Alto, Mountain View, San Francisco, California; Pittsburgh, Pennsylvania; Bozeman, Montana; Coppell, Texas; Wixom, Michigan; and Seattle, Washington. The Company designs and develops the Aurora Driver, which is the hardware, software, and data services that allow vehicles to drive themselves.
Basis of Presentation and Principles of Consolidation
The unaudited condensed consolidated financial statements have been prepared in conformity with U.S. generally accepted accounting principles (“GAAP”) and include the Company and wholly owned subsidiaries. All intercompany transactions and balances have been eliminated in consolidation. Certain information and note disclosures normally included in financial statements prepared in accordance with GAAP have been condensed or omitted pursuant to rule and regulations of the Securities and Exchange Commission (“SEC”).
The information included herein should be read in conjunction with the audited financial statements and accompanying notes for the years ended December 31, 2020 and 2019. The condensed consolidated balance sheet as of December 31, 2020 included in the condensed consolidated financial statements was derived from the audited financial statements as of that date.
The condensed consolidated financial statements reflect, in the opinion of management, all adjustments of a normal, recurring nature necessary to fairly present our balance sheet, results of operations, and cash flows for six month period but are not necessarily indicative of the expected results for the full fiscal year or any future year.
(2) |
Significant Accounting Policies |
No changes have been made to the significant accounting policies described in the audited financial statements and accompanying notes as of and for the years ended December 31, 2020 and 2019 that have a material impact on the condensed consolidated financial statements and accompanying notes.
Use of Estimates
The preparation of condensed consolidated financial statements in conformity with GAAP requires management to make estimates and assumptions that affect the reported amounts of assets and liabilities and disclosure of contingent assets and liabilities at the date of the financial statements and the reported amounts of expenses during the reporting period. Actual results could differ from those estimates. Significant items subject to such estimates and assumptions include the useful lives of property and equipment; valuation allowance for deferred income tax assets, valuation of acquired intangible assets, fair value of options granted under the Company’s stock-based compensation plans, present value of the lease liability, and the assumptions used in determining the recognition of revenue.
Significant Risks and Uncertainties Including Business and Credit Concentrations
The Company’s principal operations are the research, design, and implementation of the Aurora Driver. The Company is currently researching and developing its proprietary technology with the goal of
F-72
commercializing the Aurora Driver. The Company expects that it will need to raise additional capital to support its development and commercialization activities. Significant risks and uncertainties to the Company’s operations include failing to secure additional funding and the threat of other companies developing and bringing to market similar technology at an earlier time than the Company.
Financial instruments that potentially subject the Company to concentration of credit risk consist primarily of cash and cash equivalents. The Company maintains its cash and cash equivalents at U.S. commercial banks. Cash and cash equivalents deposited with domestic commercial banks generally exceed the Federal Deposit Insurance Corporation insurable limit. To date, the Company has not experienced any losses on its deposits of cash and cash equivalents.
On March 11, 2020, the World Health Organization declared the novel strain of coronavirus,
COVID-19,
a global pandemic and recommended containment and mitigation measures worldwide. As of the date of these financial statements, the Company has not experienced a negative impact to its financial position, results of operations, and operating cash flows. The Company cannot accurately predict the length or severity of this pandemic and the impact it might have on the world and domestic economies. However, the Company believes that for the foreseeable future, based on its current capital resources and its operations and cash flows, it will not be materially nor negatively affected. Recently Issued Accounting Standards – Not Yet Adopted
In December 2019, the FASB issued ASU , which simplifies accounting for income taxes by revising or clarifying existing guidance in ASC 740, Income Taxes, as well as removing certain exceptions within ASC 740. The new standard is effective for annual periods beginning after December 15, 2021 and earlier adoption permitted. The standard will be effective for the Company on January 1, 2022. The Company is currently evaluating the impact of this guidance.
2019-12,
Simplifying the Accounting for Income Taxes
In June 2016, the FASB issued ASU
2016-13,
Financial Instruments—Credit Losses (Topic 326): Measurement of Credit Losses on Financial Instruments, that replaces the incurred loss impairment methodology in current GAAP. The new impairment model requires immediate recognition of estimated credit losses expected to occur for most financial assets and certain other instruments. Entities will apply the standard’s provisions as a cumulative-effect adjustment to retained earnings as of the beginning of the first effective reporting period. The Company is currently evaluating the impact of this guidance and the timing of adoption. Recently Issued Accounting Standards – Adopted in Fiscal 2021
In August 2018, the FASB issued
ASU No. 2018-15,
Intangibles—Goodwill and Other-Internal-Use
Software (Subtopic 350-40):
Customer’s Accounting for Implementation Costs Incurred in a Cloud Computing Arrangement That Is a Service Contract, which aligns the requirements for capitalizing implementation costs incurred in a hosting arrangement that is a service contract with the requirements for capitalizing implementation costs incurred to develop or obtain internal-use
software. The new standard requires capitalized costs to be amortized on a straight-line basis generally over the term of the arrangement, and the financial statement presentation for these capitalized costs would be the same as that of the fees related to the hosting arrangements. The standard was effective for the Company on January 1, 2021 and applied prospectively. The adoption did not have a material impact. (3) |
Fair Value Measurements |
The Company uses a three-level hierarchy, which prioritizes, within the measurement of fair value, the use of market-based information over entity-specific information for fair value measurement based on the nature of inputs used in the valuation of an asset or liability as of the measurement date. Fair value focuses on an exit price and is defined as the price that would be received to sell an asset or paid to transfer a liability in an
F-73
orderly transaction between market participants at the measurement date. The inputs or methodology used for valuing financial instruments are not necessarily an indication of the risk associated with those financial instruments.
The three-level hierarchy for fair value measurements is defined as follows:
Level
1:
Level
2:
Level
3:
An asset or liability’s categorization within the valuation hierarchy is based upon the lowest level of input that is significant to the fair value measurement.
The following table summarizes the Company’s fair value hierarchy for its financial assets measured at fair value on a recurring bases as of June 30, 2021 and December 31, 2020:
As of June 30, 2021 |
||||||||||||||||
Level 1 |
Level 2 |
Level 3 |
Total |
|||||||||||||
| Cash equivalents: |
||||||||||||||||
| Money market funds |
$ | $ | — | $ | — | $ | ||||||||||
| |
|
|
|
|
|
|
|
|||||||||
| Total cash equivalents |
$ | $ | — | $ | — | $ | ||||||||||
| |
|
|
|
|
|
|
|
|||||||||
As of December 31, 2020 |
||||||||||||||||
Level 1 |
Level 2 |
Level 3 |
Total |
|||||||||||||
| Cash equivalents: |
||||||||||||||||
| Money market funds |
$ | $ | — | $ | — | $ | ||||||||||
| |
|
|
|
|
|
|
|
|||||||||
| Total cash equivalents |
$ | $ | — | $ | — | $ | ||||||||||
| |
|
|
|
|
|
|
|
|||||||||
(4) |
Acquisitions |
Apparate USA LLC
On January 19, 2021, the Company acquired 100 % of the voting interests of Apparate USA LLC (“Uber Advanced Technologies Group” or “ATG”) which was a company developing self-driving technology.
The ATG acquisition date fair value of the consideration transferred for ATG was approximately $1,915,708 which consisted of stock consideration. The stock consideration transferred comprised 50,873,075 shares of the Company’s Series 116,173,646 shares of the Company’s common stock. The preferred stock was valued referencing a subsequent purchase of the Company’s
U-1
preferred stock and Series U-2
redeemable convertible preferred stock. The common stock was valued based on the fair value as of January 19, 2021, as determined by a third-party valuation expert using an Option Pricing Method model. The transaction costs associated with the acquisition were approximately $15,113 and were recorded in general and administrative expense in the six months ended June 30, 2021.
The Company has accounted for the ATG acquisition as a business combination, and therefore the assets acquired and liabilities assumed were recognized at their fair values on the date of the ATG acquisition. Information which existed as of the acquisition date but is yet unknown to us may result in adjustments during the remainder of the measurement period which will not exceed 12 months from the closing date. The area not finalized relates to the valuation of acquired tangible and intangible assets and accrued expenses.
F-74
We recorded a measurement period adjustment to the preliminary purchase price allocation which included an $21,652 decrease in property and equipment, net and an $21,652 increase in goodwill. The adjustment resulted in $1,676 reduction in accumulated depreciation for expense previously recorded for the three months ended March 31, 2021. This measurement period adjustment was made to reflect facts and circumstances that existed as of the acquisition date.
The following table summarizes the fair values of assets acquired and liabilities assumed as of the date of the ATG acquisition:
| Cash and cash equivalents |
$ | |||
| Prepaid expenses and other current assets |
||||
| Property and equipment, net |
||||
| Operating lease right-of-use |
||||
| Other assets |
||||
| Acquisition related intangible assets |
||||
| Goodwill |
||||
| Accounts payable |
( |
) | ||
| Related party payable |
( |
) | ||
| Accrued expenses and other current liabilities |
( |
) | ||
| Operating lease liabilities |
( |
) | ||
| |
|
|||
| Total |
$ | |||
| |
|
The sole identifiable intangible asset acquired in the ATG acquisition was
in-process
research and development (IPR&D) and has an indefinite useful life as of the date of the acquisition. The fair value of the IPR&D intangible asset was determined through a replacement cost approach, which identifies the costs that would be necessary to recreate the asset if the Company were to internally develop the acquired technology. Significant unobservable inputs include overhead costs, profit margin, opportunity cost, and obsolescence. Our estimate of the fair value is preliminary and subject to change. The asset has not been placed into service and there have been no impairment charges related to the intangible asset as of June 30, 2021.
The excess of purchase consideration over the fair value of net tangible and identifiable intangible assets acquired was recorded as goodwill, which is primarily attributed to the assembled workforce, and is not deductible for tax purposes.
Separately, the Company recognized $7,873 in
non-cash
compensation expense for severance payments by the former parent of ATG. This amount was allocated from total equity consideration transferred. The following supplemental pro forma information combines the historical results of Aurora and ATG as if the ATG acquisition had occurred on January 1, 2020, the beginning of the earliest period presented and includes pro forma adjustments related to depreciation and amortization of acquired property, plant and equipment, share-based compensation expense, and severance expense.
Six months ended June 30, |
||||||||
2021 |
2022 |
|||||||
| Revenue |
$ |
|
$ |
|
||||
| Net loss |
$ | ( |
) | $ | ( |
) | ||
The pro forma combined financial statements do not necessarily reflect what the Company’s results of operations would have been had the ATG acquisition occurred on the date indicated.
F-75
OURS Technology, Inc.
On March 5, 2021, the Company acquired 100 % of the voting interests in OURS Technology, Inc. (“OURS”), a silicon photonics company. The Company has included the financial results of OURS in the condensed consolidated financial statements prospectively from the date of acquisition. The OURS acquisition date fair value of the consideration transferred for OURS was approximately $40,821 , which consisted of the following
Fair Value |
||||
| Cash |
$ | |||
| Stock Consideration |
||||
| Assumed liabilities related to third-party expenses |
||||
| |
|
|||
| Total |
$ | |||
| |
|
|||
As part of the OURS acquisition, the Company assumed certain OURS compensation agreements, including the conversion of certain shares of OURS restricted stock into rights to receive the Company’s restricted stock, and assuming certain stock options with an estimated fair value of $
. For the stock options assumed, based on the service period related to the period prior to the OURS acquisition date, $
was allocated to the purchase price, and $
relating to post-acquisition services which will be recorded as operating exp
e
nses over the remaining requisite service periods.The stock consideration transferred comprised 2,793,699 shares of the Company’s common stock including 182,449 shares of restricted stock granted. The restricted stock awards (RSAs) were valued based on the March 5, 2021 fair value, as determined by a third party valuation expert using an Option Pricing Method model, and the estimated fair value of the stock options assumed by the Company was determined using the Black-Scholes option pricing model. The RSAs vest monthly over a
2 -year period starting on the vesting commencement date and expire once the holder ceases to be a service provider of the Company.
The transaction costs associated with the OURS acquisition were approximately $262 and were recorded in general and administrative expense in the six months ended June 30, 2021.
The Company has accounted for the OURS acquisition as a business combination, and therefore the assets acquired and liabilities assumed were recognized at their fair values on the date of the OURS acquisition. Information which existed as of the acquisition date but is yet unknown to us may result in adjustments during the remainder of the measurement period which will not exceed 12 months from the closing date. The area not finalized is the valuation of acquired intangible assets.
The following table summarizes the fair values of assets acquired and liabilities assumed as of the date of the OURS acquisition:
Fair Value |
||||
| Cash and cash equivalents |
$ | |||
| Prepaid expenses and other current assets |
||||
| Property and equipment, net |
||||
| Other assets |
||||
| Acquisition related intangible assets |
||||
| Goodwill |
||||
| Accounts payable |
( |
) | ||
| Deferred tax liability |
( |
) | ||
| |
|
|||
| Total |
$ | |||
| |
|
|||
The sole identifiable intangible asset acquired in the OURS acquisition was
in-process
research and development (IPR&D) and has an indefinite useful life as of the date of the acquisition. The fair value of the IPR&D intangible asset was determined through a replacement cost approach, which identifies the costs that F-76
would be necessary to recreate the asset if the Company were to internally develop the acquired technology. Significant unobservable inputs include profit margin and opportunity cost. Our estimate of the fair value is preliminary and subject to change.
The asset has not been placed into service and there have been no impairment charges related to the intangible asset as of June 30, 2021.
The excess of purchase consideration over the fair value of net tangible and identifiable intangible assets acquired was recorded as goodwill, which is primarily attributed to the assembled workforce, and is not deductible for tax purposes.
Pro forma results for the OURS acquisition are not presented as the financial impact is immaterial.
(5) |
Balance sheet details |
Deposit liability
In January 2021, we entered into a collaboration framework agreement with Toyota with the intention of deploying the Aurora Driver into a fleet of Toyota Sienna vehicles, subject to further agreement of a collaboration project plan. In April 2021, we received a $50,000 payment from Toyota as a part of this collaboration agreement and it is recorded as a deposit liability pending finalization of the project plan.
Property and Equipment
Property and equipment consist of the following as of June 30, 2021 and December 31, 2020:
As of |
||||||||
June 30, 2021 |
December 31, 2020 |
|||||||
| Land |
$ | $ |
|
|||||
| Building |
|
|||||||
| Furniture and fixtures |
||||||||
| Test and lab equipment |
||||||||
| Leasehold improvements |
||||||||
| Computer and equipment |
||||||||
| Computer software |
||||||||
| Automobile |
||||||||
| |
|
|
|
|||||
| Less accumulated depreciation and amortization |
( |
) | ( |
) | ||||
| |
|
|
|
|||||
| Total property and equipment |
$ | $ | ||||||
| |
|
|
|
|||||
Accrued expenses and other current liabilities
Accrued expenses and other current liabilities consist of the following as of June 30, 2021 and December 31, 2020:
As of |
||||||||
June 30, 2021 |
December 31, 2020 |
|||||||
| Accrued expenses |
$ | $ | ||||||
| Accrued compensation |
||||||||
| Other |
||||||||
| |
|
|
|
|||||
| Total accrued expenses and other current liabilities |
$ | $ | ||||||
| |
|
|
|
|||||
F-77
(6) |
Capital Stock |
| (a) | Common Stock |
The Company is authorized to issue 535,000,000 0.0001 249,724,461 128,434,407 one vote per share
(b) |
Redeemable Convertible Preferred Stock |
The Company is authorized to issue 214,425,920 shares, par value of $0.0001 20,177,530 9,653,930 29,948,750 78,065,640 2,580,070 53,000,000 21,000,000
B-1,
U-1
and Series U-2.
At June 30, 2021, the Company had 20,177,530 9,653,930 29,948,750 71,389,540 2,557,518 50,873,075 20,349,230
Series B-1,
Series U-1
and Series U-2
issued and outstanding. (i) |
Dividends |
The holders of Seed 1, Seed 2, Series A, Series B, Series 0.014 per share per annum for Seed 1, $0.026 per share per annum for Seed 2, $0.222 per share per annum for Series A, $0.739 per share per annum for Series B, $1.5730 per share per annum for Series 1.5730 per share per annum for Series
U-1,
and Series U-2
(collectively, the “Senior Preferred Stock”) are entitled to receive dividends, when, as and if declared by the board of directors of the Company, out of any available assets of the Company. The annual dividend rate is $U-1,
and $U-2
(subject to adjustment from time to time for recapitalization with respect to each such series of preferred stock). The right to receive dividends on shares of Senior Preferred Stock is not cumulative, and payment of any dividends to the holders of Senior Preferred Stock is on a pro rata pari passu basis in proportion to the dividend rates for each series of Senior Preferred Stock. Subject to the prior dividend rights of the Senior Preferred Stock, the holders of outstanding shares of Series 0.739 per share per annum for Series
B-1
shall be entitled to receive divide
nds, when, as and if declared by the board of directors of the Company, out of any available assets of the Company. The annual dividend rate is $B-1
(subject to adjustment from time to time for recapitalization with respect to each such series of redeemable convertible preferred stock). The right to receive dividends on shares of Series B-1
shall not be cumulative and payment of any dividends to the holders of Series B-1
shall be on a pro rata pari passu basis in proportion to the dividend rates for Series B-1.
After dividends in the full preferential amounts specified for the preferred stock have been paid or set aside, any additional dividends shall be paid among the holders of the redeemable convertible preferred stock and common stock in proportion to the greatest whole number of shares of common stock, which would be held by each holder if all shares of redeemable convertible preferred stock were converted at the then effective conversion rate. The Company has no t declared any dividends as of June 30, 2021.
(ii) |
Conversion |
At the option of the holder, each share of redeemable convertible preferred stock shall be convertible, at any time after the date of issuance of such share, into the number of shares of common stock determined by dividing the original issue price for the redeemable convertible preferred stock by the applicable conversion price, determined at the time of conversion. The original issue price and the conversion price will be adjusted for any stock dividends, stock splits, combination of shares, reorganizations, recapitalizations, reclassifications, or other similar events.
F-78
The conversion price of each series of redeemable convertible preferred stock is also subject to broad-based weighted average anti-dilution adjustments in the event that the Company issues certain securities at a price per share less than the then applicable conversion price of such series of redeemable convertible preferred stock.
Each share of redeemable convertible preferred stock will automatically be converted into common stock at the then effective conversion rate (i) immediately prior to (x) the initial listing of the capital stock on an internationally recognized securities exchange approved by means of an effective registration statement filed with the Securities and Exchange Commission or (y) completion by the Company of transaction(s) by merger, consolidation, share exchange, or otherwise with a publicly traded “special purpose acquisition company” in which the share capital of such entity is listed on an internationally recognized securities exchange approved by the Company’s board of directors, provided that the aggregate gross proceeds to the Company are not less than $100,000 or (ii) upon the written consent for such conversion from each of (A) the holders of a majority of the outstanding redeemable convertible preferred stock other than the Series
U-1
(voting together as a single class and on an as-converted
basis) and (B) the holders of a majority of outstanding of Series B (voting as a separate class) provided that in the case of a conversion pursuant to the preceding clause (ii) in connection with a liquidation, dissolution or winding up of the Company in which Company’s holders of capital stock receive consideration pursuant to a distribution or repurchase of capital stock, the Series U-2
shall not be converted unless approved by the holders of a majority of the Series U-2
redeemable convertible preferred stock. (iii) |
Liquidation |
In the event of any liquidation, dissolution, or winding up of the Company, the holders of then outstanding Senior Preferred Stock are entitled to be paid on a pari passu basis, and prior and in preference to any distribution on any share of Series 0.175 for Seed 1, $0.322 for Seed 2, $2.776 for Series A, $9.240 for Series B, $19.657 for Series 19.657 for Series 75 %, in the case of Series
B-1
and common stock, an amount per share equal to (1) the greater of (a) the sum of (i) the liquidation preference specified for such share of Senior Preferred Stock ($U-1,
and $U-2)
and (ii) all declared but unpaid dividends on such share of Senior Preferred Stock or (b) the amount that would have been payable if such share of Senior Preferred Stock had converted to common stock immediately prior to such liquidation, dissolution or winding up, or (2) with respect to a particular series of Senior Preferred Stock, such lesser amount as may be approved by the holders of a majority (or at least U-1)
of the outstanding shares of such series, voting as a separate series. Subject to the prior liquidation rights of the Senior Preferred Stock, in the event of any liquidation, dissolution, or winding up of the Company, the holders of the then outstanding Series 9.240 ) and (ii) all declared but unpaid dividends on such share of Series
B-1,
are entitled to be paid on a pari passu basis, and prior and in preference to any distribution on any share of common stock, an amount per share equal to (1) the greater of (a) the sum of (i) the liquidation preference specified for such share of Series B-1
(currently $B-1
or (b) the amount that would have been payable if such shares of series B-1
had converted to common stock immediately prior to such liquidation, dissolution or winding up, or (2) such lesser amount as may be approved by the holders of a majority of the outstanding shares of Series B-1,
voting as a separate series. After the payment of the full liquidation preference to the holders of preferred stock described above, the assets of the Company legally available for distribution, if any, shall be distributed pro rata to holders of the common stock of the Company in proportion to the number of shares of common stock held by them.
The liquidation preferences are deemed to be contingent redemption features exercisable on certain deemed liquidation events which includes a merger, change of control, or a sale of substantially all of the Company’s assets. The deemed liquidation event would constitute a
F-79
redemption event not solely within the control of the Company. Redeemable convertible preferred stock is presented outside of permanent equity in mezzanine equity on the balance sheets. It is not probable that the Preferred Stock will become redeemable as of June 30, 2021.
(iv) |
Voting |
The holders of shares of redeemable convertible preferred stock are entitled to the number of votes equal to the number of shares of common stock into which the shares are then convertible. As long as any shares of Seed 1 remain outstanding, the holders of Seed 1, voting as a separate class, are entitled to elect one member of the board of directors (the Series Seed Director). As long as any shares of Series B remain outstanding, the holders of Series B preferred stock, voting as a separate class, are entitled to elect one member of the board of directors. As long as any shares of Series
U-2
remaining outstanding, the holders of Series U-2,
voting as a separate class, are entitled to elect two members of the board of directors. The holders of common stock, Seed 2, Series A and Series B-1,
voting together as a single class on an as converted basis, are entitled to elect five members of the board of directors. Any additional members of the board of directors shall be elected by the holders of common stock and redeemable convertible preferred stock. So long as the holders of Seed 1 are entitled to elect a director, the Series Seed Director shall be entitled to cast two votes on all matters that come before the board of directors. All remaining directors shall be entitled to cast one vote on all matters.
(v) |
Protective Provision |
As long as any shares of redeemable convertible preferred stock are issued and outstanding, the approval of holders of a majority of outstanding shares of redeemable convertible preferred stock, voting together as a single class on an 250,000 (subject to limited exceptions); and creating or holding capital stock in a subsidiary that is not wholly owned.
as-converted
basis, is required in order for the Company to take certain actions. Such actions include adversely amending the rights, preferences, privileges, or restrictions provided for the benefit of preferred stock; purchasing, redeeming, paying, or declaring any dividend or making any distribution on any shares of capital stock (subject to limited exceptions); and creating or authorizing the issuance of any debt security or other indebtedness for borrowed money in excess of $(7) |
Stock Option Plan |
We maintain three equity compensation plans: the 2017 Equity Incentive Plan (the Plan), the 2016 Blackmore Sensors & Analytics, Inc. Equity Incentive Plan (the Blackmore Plan), and the OURS Technologies Inc Equity Incentive Plan (the OURS Plan). The Company assumed stock options under the Blackmore Plan in 2019 and the OURS Plan in 2021 to the extent such employees continued as employees of the Company.
2017 Equity Incentive Plan
In 2017, the Company adopted the Plan. Under the Plan, equity-based compensation in the form of restricted stock units (RSUs), restricted stock awards, incentive stock options, and nonqualified stock options may be granted to employees, officers, directors, consultants, and others. 77,502,791 shares are authorized and 9,175,894 are available to grant as of June 30, 2021.
Stock Options
Stock options under the Plan may be outstanding for periods of up to 10 years following the grant date. The exercise price of stock options for the purchase of shares of common stock under the Plan may not be less than 100 % of the fair value of the Company’s common stock on the date of the grant, as determined by the
F-80
board of directors. In the case of an incentive stock option granted to an employee who owns stock representing more than 10 % of the voting shares, the price of each share will be at least 110 % of the fair value on the date of grant. Stock options generally vest over four years starting on the vesting commencement date (with a 10 years from the date of grant or, if earlier, three months after the option holder ceases to be a service provider of the Company. Stock options granted to a stockholder that owns greater than 10 % of the company expire, if not exercised, five years from the date of grant.
one-year
cliff) and expire, if not exercised, The fair value of each award granted to employees in the six months ended June 30, 2021 has been estimated on the date of grant using the Black-Scholes-Merton option pricing model with the following weighted average assumptions: expected life of 5.93 years, risk-free interest rate of 0.59 %; expected volatility of 55.00 %; and no dividends during the expected life. Expected volatility is based on the Company’s review of historical volatilities of comparable public companies and an expected future volatility based upon this evidence over the expected term of the award. The expected life of the options represents the period of time options are expected to be outstanding and is estimated considering vesting terms, employees’ historical exercise, and post vesting employment termination behavior. The risk-free interest rate is based on the U.S. Treasury yield curve in effect at the time of grant. The Company records forfeitures on the date occurred.
Stock option activity under the Plan in the six months ended June 30, 2021 is as follows:
Options outstanding |
||||||||
Number of Shares |
Weighted average exercise price |
|||||||
| Balance, December 31, 2020 |
$ | |||||||
| Granted |
||||||||
| Exercised |
( |
) | ||||||
| Forfeited |
( |
) | ||||||
| |
|
|
|
|||||
| Balance, June 30, 2021 |
$ | |||||||
| |
|
|
|
|||||
The compensation expense recognized for options for the six months ended June 30, 2021 and June 30, 2020 was $12,458 and $7,385 , respectively. The unrecognized deferred compensation expense for future years’ compensation expense was $50,981 as of June 30, 2021. Unrecognized deferred compensation will be recognized over an estimated weighted average amortization period of approximately 2.76 years.
Restricted Stock Units
The vesting of the RSUs is based on the satisfaction of 2 separate vesting requirements on or before the expiration date: (1) a time-based vesting requirement, and (2) a liquidity event. The liquidity event is the earlier of a (i) an initial public offering through a registration statement filed by the Company declared effective or the closing of a transaction with a special purpose acquisition company, or (ii) a change in control. Generally, the time-based vesting requirement is four years starting on the vesting commencement date (with a RSU activity under the Plan is as follows:
one-year
cliff). Unvested RSUs outstanding |
||||||||
Number of shares |
Weighted- Average Grant Date Fair Value |
|||||||
| Balance, December 31, 2020 |
|
|||||||
| Granted |
$ | |||||||
| Forfeited |
( |
) | ||||||
| |
|
|
|
|||||
| Balance, June 30, 2021 |
$ | |||||||
| |
|
|
|
|||||
F-81
As of June 30, 2021, no stock-based compensation has been recognized for the RSUs. The liquidity event is a performance condition where the condition was not deemed probable as of June 30, 2021. No compensation expense was recognized during the period and the unrecognized deferred compensation expense was $143,514 as of June 30, 2021. $32,805 of this amount relates to awards where the time-based vesting requirements was satisfied.
Stock-based payments awarded by a related party
Prior to the ATG acquisition, employees of ATG received grants of RSUs in the former ultimate parent company of ATG, a related party after the closing of the transaction. These awards were modified after the transaction to allow the awards to continue to vest for the first year subsequent to the closing of the acquisition as long as personnel remain employees of the Company. These awards are compensation for services provided to the Company and accounted for as stock-based compensation.
Awards representing 2,928,854 shares were modified on the acquisition date. 284,841 shares were forfeited as of June 30, 2021. The fair value of these awards is equal to the market value of the related party’s common stock on the date of modification. $64,994 in stock-based compensation expense was recognized in the six months ended June 30, 2021.
The unrecognized deferred compensation expense for future years’ compensation expense is $81,949 as of June 30, 2021. Unrecognized deferred compensation will be recognized over an estimated weighted average amortization period of approximately 0.56 years.
Stock-based Compensation Expense
Stock-based compensation is allocated on a departmental basis, based on the classification of the option holder or grant recipient. No income tax benefits have been recognized in the statement of operations for stock-based compensation arrangements and no stock-based compensation has been capitalized as of June 30, 2021.
Total stock-based compensation expense by function was as follows (in thousands):
Six Months Ended June 30, |
||||||||
2021 |
2020 |
|||||||
| Research and Development |
$ | $ | ||||||
| Selling, general, and administrative |
||||||||
| |
|
|
|
|||||
| Total |
$ | $ | ||||||
| |
|
|
|
|||||
(8) |
Income Taxes |
The income tax benefit recognized differs from our statutory tax rate of 21 % primarily due to valuation allowance movements.
(9) |
Leases |
The Company leases its office facilities, data centers, and warehouses in Palo Alto, California; Mountain View, California; Pittsburgh, Pennsylvania; Bozeman, Montana; Coppell, Texas; Wixom, Michigan; Seattle, Washington; and Ashburn, Virginia, under non cancelable operating lease agreements that expire between 2021 through 2035. One acquired lease in Pittsburgh has renewal options the Company is reasonably certain to exercise which result in a lease term to 2042.
F-82
As of June 30, 2021, the Company’s operating leases had a weighted average remaining lease term of 10.3 years and a weighted average discount rate of 6.39 %. Future minimum payments under
non-cancelable
operating leases (with initial or remaining lease terms in excess of one year) and other contractual commitments as of June 30, 2021 were as follows:Operating leases |
||||
| Year ending December 31, |
||||
| 2021 |
$ | |||
| 2022 |
||||
| 2023 |
||||
| 2024 |
||||
| 2025 |
||||
| Thereafter |
||||
| |
|
|||
| Total |
$ | |||
| |
|
|||
Rent expense under operating leases was $12,012 in the six months ended June 30, 2021. Rent expense was $5,896 in the six months ended June 30, 2020.
In March 2021, the Company remeasured the right of use asset for the Mountain View headquarters which included reclassifying $16,998 from other current assets related to variable payments to construct landlord owned assets. These payments were treated as variable payments as the total amount to be paid for these assets was unknown at the lease commencement date. As the project was completed in March 2021 and the total amounts to be paid by the Company were known, the right of use asset was remeasured and the adjustment was recorded during the period ended March 31, 2021.
(10) |
Commitments and Contingencies |
From time to time the Company may be party to various claims in the normal course of business. Legal fees and other costs associated with such actions are expensed as incurred. The Company assesses the need to record a liability for litigation and loss contingencies. Reserve estimates are recorded when and if it is determined that a loss related to certain matters is both probable and reasonably estimable. No
Future minimum payments for contractual commitments related to purchase obligations as of June 30, 2021 were as follows:
Purchase obligation |
||||
| Year ending December 31, |
||||
| 2021 |
$ | |||
| 2022 |
||||
| 2023 |
||||
| 2024 |
||||
| 2025 |
|
|||
| Thereafter |
|
|||
| |
|
|||
| Total |
$ | |||
| |
|
|||
(11) |
Employee Benefit Plan |
The Company sponsors the Aurora 401(k) plan. All employees are eligible to participate in the plans after meeting eligibility requirements. Participants may elect to have a portion of their salary deferred and contributed to the plan up to the limit allowed by applicable income tax regulations. The Company may
F-83
make a matching contribution at the discretion of the board of directors. The Company recognized $0
202
0, respectively. (12) |
Supplemental Cash Flow Information |
Cash paid for income taxes was $0 in the six months ended June 30, 2021 and 2020, respectively. Cash paid for interest and noncash investing and financing activities were as follows:
June 30, 2021 |
June 30, 2020 |
|||||||
| Noncash investing and financing activities: |
||||||||
| Property and equipment included in accounts payable |
$ | $ | ||||||
| Vesting of early exercised stock options |
||||||||
| Non-cash acquisition |
— | |||||||
| Cash, cash equivalents, and restricted cash at end of period: |
||||||||
| Cash and cash equivalents |
$ | $ | ||||||
| Restricted cash |
||||||||
| |
|
|
|
|||||
| Total cash, cash equivalents, and restricted cash |
$ | $ | ||||||
| |
|
|
|
|||||
(13) |
Earnings Per Share |
Series Seed 1 preferred stock, Series Seed 2 preferred stock, Series A preferred stock, Series B preferred stock, Series
B-1
preferred stock, Series U-1,
Series U-2,
unvested Restricted Stock Awards (“RSA”), unvested early exercised stock options, and unvested RSUs are participating securities in periods of income as the securities participate in undistributed earnings. The securities do not share in losses. The Company computes earnings per share of common stock using the
two-class
method required for participating securities and does not apply the two-class
method in periods of net loss. Basic earnings per share is computed using the The computation of basic and diluted earnings per share is the same as the inclusion of all potential common stock would have been anti-dilutive in a period of net loss.
two-class
method required for participating securities but is not applied in fiscal periods with a net loss. Six months ended June 30, |
||||||||
2021 |
2020 |
|||||||
| Numerator: |
| |||||||
| Net Loss |
$ | ( |
) | $ | ( |
) | ||
| Net loss per share: |
||||||||
| Basic |
$ | ( |
) | $ | ( |
) | ||
| Diluted |
$ | ( |
) | $ | ( |
) | ||
| Denominator: |
||||||||
| Weighted average common shares outstanding - Basic |
||||||||
| Weighted average common shares outstanding - Diluted |
||||||||
F-84
The following table presents the potential common stock outstanding excluded from the computation of diluted loss per share because including them would have had an antidilutive effect:
June 30, |
||||||||
2021 |
2020 |
|||||||
| Series Seed 1 Preferred Stock |
||||||||
| Series Seed 2 Preferred Stock |
||||||||
| Series A Preferred Stock |
||||||||
| Series B Preferred Stock |
||||||||
| Series B-1 Preferred Stock |
||||||||
| Series U-1 Preferred Stock |
— | |||||||
| Series U-2 Preferred Stock |
— | |||||||
| Stock Options |
||||||||
| Restricted Stock Awards |
||||||||
| Restricted Stock Units |
— | |||||||
| Grants available under the 2017 Equity Incentive Plan |
||||||||
| |
|
|
|
|||||
| Total |
||||||||
| |
|
|
|
|||||
(14) |
Related Parties |
In January 2021, the Company paid $10,000 relating to financial advisory fees with a related party for a contract that was entered into by the Company in December 2020. $8,250 was recognized in selling, general and administrative expenses and $1,750 was recognized as a reduction to redeemable convertible preferred stock for issuance costs in the six months ended June 30, 2021. No amounts were due as of June 30, 2021.
The Company assumed a net liability of $46,970 from the ATG acquisition for an obligation due to the former owner of ATG who is a related party of the Company subsequent to the acquisition. The net obligation was a $54,777 related party payable offset by a $7,808 related party receivable for certain services performed by the former owner of ATG on behalf of ATG, and vice versa, prior to the closing of the acquisition. The services include administering an employee equity incentive plan, shared personnel, and other centralized services. No amounts were due as of June 30, 2021.
In January 2021, the former owner of ATG made payment of $7,873 in severance to former employees of ATG which will be reimbursed by the Company. Expense of $6,320 was recognized in research and development expenses and $1,552 was recognized in selling, general, and administrative expenses in the six months ended June 30, 2021. No amounts were due as of June 30, 2021.
We recognized $3,087 in the six months ended June 30, 2021 in selling, general, and administrative expenses for the transition service agreement with the former owner of ATG. As of June 30, 2021, $1,422 of related party payables was recorded on the consolidated balance sheet.
(15) |
Subsequent Events |
On July 14, 2021, the Company entered into a merger agreement with Reinvent Technology Partners Y (“RTPY”), a special purpose acquisition company and related party. At the effective time of the merger, the Company becomes a wholly owned subsidiary of RTPY which changes its name to Aurora Innovation, Inc. (“Aurora Innovation”). All outstanding shares of the Company’s capital stock, together with shares of common stock reserved in respect of awards outstanding, are cancelled in exchange for the right to receive shares of Aurora Innovation.
In August 2021, the Company entered into a $300,000 cloud computing contract to support the Company’s computing and storage needs. The contract commences in August 2021 and has a term of approximately five years .
F-85
F-86
Apparate USA LLC
Consolidated Financial Statements
December 31, 2019 and 2020
Table of Contents
Page(s) |
||||
F-88 |
||||
| Consolidated Financial Statements |
||||
F-89 |
||||
F-90 |
||||
F-91 |
||||
F-92 |
||||
F-93 |
||||
F-87
Report of Independent Auditors
To the Management of Apparate USA LLC
We have audited the accompanying consolidated financial statements of Apparate USA LLC and its subsidiaries, which comprise the consolidated balance sheets as of December 31, 2020 and December 31, 2019, and the related consolidated statements of operations, of member equity and of cash flows for the year ended December 31, 2020 and for the period from April 8, 2019 to December 31, 2019.
Management’s Responsibility for the Consolidated Financial Statements
Management is responsible for the preparation and fair presentation of the consolidated financial statements in accordance with accounting principles generally accepted in the United States of America; this includes the design, implementation, and maintenance of internal control relevant to the preparation and fair presentation of consolidated financial statements that are free from material misstatement, whether due to fraud or error.
Auditors’ Responsibility
Our responsibility is to express an opinion on the consolidated financial statements based on our audits. We conducted our audits in accordance with auditing standards generally accepted in the United States of America. Those standards require that we plan and perform the audit to obtain reasonable assurance about whether the consolidated financial statements are free from material misstatement.
An audit involves performing procedures to obtain audit evidence about the amounts and disclosures in the consolidated financial statements. The procedures selected depend on our judgment, including the assessment of the risks of material misstatement of the consolidated financial statements, whether due to fraud or error. In making those risk assessments, we consider internal control relevant to the Company’s preparation and fair presentation of the consolidated financial statements in order to design audit procedures that are appropriate in the circumstances, but not for the purpose of expressing an opinion on the effectiveness of the Company’s internal control. Accordingly, we express no such opinion. An audit also includes evaluating the appropriateness of accounting policies used and the reasonableness of significant accounting estimates made by management, as well as evaluating the overall presentation of the consolidated financial statements. We believe that the audit evidence we have obtained is sufficient and appropriate to provide a basis for our audit opinion.
Opinion
In our opinion, the consolidated financial statements referred to above present fairly, in all material respects, the financial position of Apparate USA LLC and its subsidiaries as of December 31, 2020 and December 31, 2019, and the results of their operations and their cash flows for the year ended December 31, 2020 and for the period from April 8, 2019 to December 31, 2019 in accordance with accounting principles generally accepted in the United States of America.
Emphasis of Matter
As discussed in Note 11 to the consolidated financial statements, Uber Technologies Inc. completed the sale of the Company to Aurora Innovation Inc. on January 19, 2021.
/s/ PricewaterhouseCoopers LLP
San Francisco, California
July 8, 2021
F-88
Apparate USA LLC
Consolidated Balance Sheets
As of December 31, |
As of December 31, |
|||||||
(in thousands) |
2019 |
2020 |
||||||
| Assets |
||||||||
| Cash and cash equivalents |
$ | 787,894 | $ | 353,040 | ||||
| Prepaid expenses and other current assets |
3,331 | 1,735 | ||||||
| Related party receivables |
28 | — | ||||||
| |
|
|
|
|||||
| Total current assets |
791,253 | 354,775 | ||||||
| Property and equipment, net |
107,499 | 85,204 | ||||||
| Operating lease right-of-use |
69,051 | 29,986 | ||||||
| Other assets |
8,406 | 3,757 | ||||||
| Intangible assets, net |
32,112 | 31,046 | ||||||
| Goodwill |
28,417 | 28,417 | ||||||
| |
|
|
|
|||||
| Total assets |
$ | 1,036,738 | $ | 533,185 | ||||
| |
|
|
|
|||||
| Liabilities and Members’ equity |
||||||||
| Accounts payable |
$ | 10,456 | $ | 9,397 | ||||
| Operating lease liabilities, current |
11,902 | 5,646 | ||||||
| Accrued and other current liabilities |
64,126 | 67,675 | ||||||
| Related party payables |
9,853 | 31,568 | ||||||
| |
|
|
|
|||||
| Total current liabilities |
96,337 | 114,286 | ||||||
| Operating lease liabilities, non-current
|
58,279 | 22,907 | ||||||
| |
|
|
|
|||||
| Total liabilities |
154,616 | 137,193 | ||||||
| |
|
|
|
|||||
| Commitments and contingencies (Note 9) |
||||||||
| Members’ Equity |
||||||||
| Common Units |
(143,566 | ) | (661,112 | ) | ||||
| Convertible Class A Preferred Units |
1,025,688 | 1,057,104 | ||||||
| |
|
|
|
|||||
| Total members’ equity |
882,122 | 395,992 | ||||||
| |
|
|
|
|||||
| Total liabilities and members’ equity |
$ | 1,036,738 | $ | 533,185 | ||||
| |
|
|
|
|||||
The accompanying notes are an integral part of these financial statements.
F-89
Apparate USA LLC
Consolidated Statements of Operations
(in thousands) |
For the Period from April 8, 2019 (Inception) Through December 31, 2019 |
Year Ended December 31, 2020 |
||||||
| Revenue |
$ | 42,328 | $ | 100,000 | ||||
| Costs and expenses |
||||||||
| Sales and marketing |
4,672 | 2,100 | ||||||
| Research and development |
326,497 | 636,588 | ||||||
| General and administrative |
55,718 | 140,078 | ||||||
| Depreciation and amortization |
28,661 | 20,918 | ||||||
| |
|
|
|
|||||
| Total costs and expenses |
415,548 | 799,684 | ||||||
| |
|
|
|
|||||
| Loss from operations |
(373,220 | ) | (699,684 | ) | ||||
| Other income |
8,193 | 2,409 | ||||||
| |
|
|
|
|||||
| Loss before income taxes |
(365,027 | ) | (697,275 | ) | ||||
| Income tax expense |
(116 | ) | 1,510 | |||||
| |
|
|
|
|||||
| Net loss |
$ | (365,143 | ) | $ | (695,765 | ) | ||
| |
|
|
|
|||||
The accompanying notes are an integral part of these financial statements.
F-90
Apparate USA LLC
Consolidated Statements of Members’ Equity
Convertible Class A Preferred Units |
Common Units |
|||||||||||||||||||||||||||||||||||
(in thousands, except share amounts) |
Units |
SoftBank |
Units |
Toyota |
Units |
DENSO |
Units |
Neben |
Total Members’ Equity |
|||||||||||||||||||||||||||
| Balance as of Inception - April 8, 2019 |
— | $ | — | — | $ | — | — | $ | — | — | $ | — | $ | — | ||||||||||||||||||||||
| Issuance of Common Units |
— | — | — | — | — | — | 6,267,953 | 162,026 | 162,026 | |||||||||||||||||||||||||||
| Proceeds from sale of Preferred Units |
333,000 | 333,000 | 400,000 | 400,000 | 267,000 | 267,000 | — | — | 1,000,000 | |||||||||||||||||||||||||||
| Net loss |
— | — | — | — | — | — | — | (365,143 | ) | (365,143 | ) | |||||||||||||||||||||||||
| Capital contribution from parent stock plan |
— | — | — | — | — | — | — | 85,239 | 85,239 | |||||||||||||||||||||||||||
| Preferred returns paid in kind, including Gross Up Distribution and Incremental Distribution |
— | 10,322 | — | 9,217 | — | 6,149 | — | (25,688 | ) | — | ||||||||||||||||||||||||||
| |
|
|
|
|
|
|
|
|
|
|
|
|
|
|
|
|
|
|||||||||||||||||||
| Balance as of December 31, 2019 |
333,000 | $ | 343,322 | 400,000 | $ | 409,217 | 267,000 | $ | 273,149 | 6,267,953 | $ | (143,566) | $ | 882,122 | ||||||||||||||||||||||
| |
|
|
|
|
|
|
|
|
|
|
|
|
|
|
|
|
|
|||||||||||||||||||
| Issuance of Common Units |
— | — | — | — | — | — | 190,932 | — | — | |||||||||||||||||||||||||||
| Tax Distribution paid in cash |
— | (8,926 | ) | — | (7,843 | ) | — | (5,234 | ) | — | — | (22,003 | ) | |||||||||||||||||||||||
| Net loss |
— | — | — | — | — | — | — | (695,765 | ) | (695,765 | ) | |||||||||||||||||||||||||
| Capital contribution from transfer of lease liability to UTI |
— | — | — | — | — | — | — | 24,010 | 24,010 | |||||||||||||||||||||||||||
| Capital contribution from parent stock plan |
— | — | — | — | — | — | — | 207,628 | 207,628 | |||||||||||||||||||||||||||
| Preferred returns paid in kind, including Gross Up Distribution and Incremental Distribution |
— | 21,596 | — | 19,086 | — | 12,737 | — | (53,419 | ) | — | ||||||||||||||||||||||||||
| |
|
|
|
|
|
|
|
|
|
|
|
|
|
|
|
|
|
|||||||||||||||||||
| Balance as of December 31, 2020 |
333,000 | $ | 355,992 | 400,000 | $ | 420,460 | 267,000 | $ | 280,652 | 6,458,885 | $ | (661,112) | $ | 395,992 | ||||||||||||||||||||||
| |
|
|
|
|
|
|
|
|
|
|
|
|
|
|
|
|
|
|||||||||||||||||||
The accompanying notes are an integral part of these financial statements.
F-91
Apparate USA LLC
Consolidated Statements of Cash Flows
(in thousands) |
For the Period from April 8, 2019 (Inception) Through December 31, 2019 |
Year Ended December 31, 2020 |
||||||
| Cash flows from operating activities |
||||||||
| Net Loss |
$ | (365,143) | $ | (695,765) | ||||
| Adjustments to reconcile net loss to net cash provided by operating activities: |
||||||||
| Depreciation and amortization |
28,661 | 20,918 | ||||||
| Stock-based compensation generated from Uber (parent) stock plan |
88,012 | 113,403 | ||||||
| UTI service fees settled in equity |
— | 94,225 | ||||||
| Impairments of long-lived assets |
— | 47,880 | ||||||
| Change in operating assets and liabilities: |
||||||||
| Prepaid expenses and other current assets |
(130 | ) | 5,833 | |||||
| Operating lease right-of-use |
5,394 | 10,625 | ||||||
| Related party receivables |
3,172 | 28 | ||||||
| Accounts payable |
6,540 | (1,059 | ) | |||||
| Accrued expenses and other liabilities |
45,254 | 3,549 | ||||||
| Operating lease liabilities |
(3,783 | ) | (13,095 | ) | ||||
| Related party payables |
7,080 | 21,715 | ||||||
| |
|
|
|
|||||
| Net cash used in operating activities |
(184,943 | ) | (391,743 | ) | ||||
| |
|
|
|
|||||
| Cash flows from investing activities |
||||||||
| Purchase of property and equipment |
(28,109 | ) | (21,108 | ) | ||||
| |
|
|
|
|||||
| Net cash used in investing activities |
(28,109 | ) | (21,108 | ) | ||||
| |
|
|
|
|||||
| Cash flows from financing activities |
||||||||
| Initial contribution of cash for common units |
946 | — | ||||||
| Proceeds from issuance of preferred stock units |
1,000,000 | — | ||||||
| Tax Distribution paid in cash |
— | (22,003 | ) | |||||
| |
|
|
|
|||||
| Net cash provided by (used in) financing activities |
1,000,946 | (22,003 | ) | |||||
| |
|
|
|
|||||
| Net increase (decrease) in cash, cash equivalents and restricted cash, cash equivalents |
787,894 | (434,854 | ) | |||||
| Cash, cash equivalents and restricted cash, cash equivalents |
||||||||
| Beginning of period |
— | 787,894 | ||||||
| |
|
|
|
|||||
| End of period |
$ | 787,894 | $ | 353,040 | ||||
| |
|
|
|
|||||
| Supplemental disclosure of non-cash financing activity: |
||||||||
| Preferred returns paid in kind, including Gross Up Distribution and Incremental Distribution |
$ | 25,688 | $ | 53,419 | ||||
The accompanying notes are an integral part of these financial statements.
F-92
Apparate USA LLC
Notes to the Financial Statements
December 31, 2019 and 2020
Note 1 - Description of Business
Apparate USA LLC (the “Company”) is a majority-owned direct subsidiary of Neben Holdings LLC (“Neben”), which is a wholly-owned indirect subsidiary of Uber Technologies Inc. (“Uber” or “UTI”). The Company was formed under a Limited Liability Agreement in Delaware on April 8, 2019 (“Inception”), which was subsequently amended on July 2, 2019 (“Contribution”). There were no operations or cash flow activities between Inception and Contribution. Debts, obligations and liabilities of the Company shall be solely the debts, obligations and liabilities of the Company and no Member shall be obligated personally for any such debts, obligations or liabilities solely by reason of being a Member of the Company. A Member’s liability (in its capacity as such) for Company obligations, liabilities and losses shall be limited to the Company’s assets; provided, that a Member shall be required to return to the Company any distribution made to it in clear and manifest accounting or similar error. Uber contributed all assets of its Advanced Technologies Group (“ATG”) to Neben, which in turn contributed all assets of ATG to the Company in exchange for common units of ownership in the Company. On December 7, 2020, Uber announced the sale of the Company to Aurora Innovation, Inc. (“Aurora”). On January 19, 2021, the sale to Aurora was completed. Refer to Note 11 - Subsequent Events for further information.
The Company’s primary operation is developing self-driving technology solutions. The Company is headquartered in Pittsburgh, Pennsylvania with teams in Pittsburgh, San Francisco, and Toronto.
Note 2 - Basis of Presentation and Summary of Significant Accounting Policies
Basis of Presentation
The accompanying consolidated financial statements have been prepared in accordance with generally accepted accounting principles in the United States (“GAAP”). The consolidated financial statements include certain assets and liabilities that have historically been held at Uber, which were contributed on July 2, 2019 to the Company at carry over basis.
Principles of Consolidation
The consolidated financial statements include the accounts of the Company and its wholly-owned subsidiaries. All intercompany balances and transactions have been eliminated.
Use of Estimates
The preparation of the Company’s consolidated financial statements in conformity with GAAP requires management to make estimates and assumptions, which affect the reported amounts in the financial statements and accompanying notes. Actual results could differ materially from the Company’s estimates. To the extent that there are material differences between these estimates and actual results, the Company’s financial condition or operating results will be affected. The Company bases its estimates on past experience and other assumptions that the Company believes are reasonable under the circumstances, and the Company evaluates these estimates on an ongoing basis.
Certain Significant Risks and Uncertainties
The Company operates in a dynamic industry and, accordingly, can be affected by a variety of factors. The Company believes that changes in any of the following areas could have a negative effect on the Company’s future financial position, results of operations, or cash flows: the impact of the economic climate on its business;
F-93
changes in the United States automotive market; retention and recruiting of qualified employees and key personnel; concentration of vendors; exposure to legal risks; access to capital; regulatory risks; and competition in the markets in which the Company operates.
Cash and Cash Equivalents
The Company maintains its funds in bank deposit accounts at reputable financial institutions with high credit quality and therefore are considered to bear limited credit risk. Deposit accounts are insured up to $250 thousand per account holder by the Federal Deposit Insurance Corporation. The Company has not experienced any losses in such accounts. Management believes that the Company is not exposed to any significant credit risk related to cash. Cash and cash equivalents as of December 31, 2019 and 2020 consisted of cash held in checking accounts
.
Property and Equipment, Net
Property and equipment are stated at cost, net of accumulated depreciation and amortization. Depreciation and amortization is computed using the straight-line method over the estimated useful lives of the assets, which are as follows:
| Property and Equipment |
Estimated Useful Life | |
| Land | Indefinite | |
| Buildings | 30 years | |
| Site improvements |
5-15 years | |
| Computer equipment |
3-5 years | |
| Furniture and fixtures |
3-5 years | |
| Leasehold improvements | Shorter of estimated useful life or lease term |
When assets are retired or otherwise disposed of, the cost, accumulated depreciation and amortization are removed from the accounts and any resulting gain or loss is reflected in the statements of operations in the period realized. Maintenance and repairs that do not enhance or extend the asset’s useful life are charged to operating expenses as incurred.
Software Development Costs
The Company follows the provisions of ASC (“ASC
350-40,
Internal Use Software
350-40”)
as the Company’s current business plan is to develop autonomous vehicles (“AV”) to drive paying customers, rather than to sell or license the underlying technology externally. AV software development costs have not yet met the criteria for capitalization given that it is not yet probable that the project will be completed and the software will be used to perform the function intended. As a result, software development costs are expensed as incurred. Leases
The Company determines if a contract contains a lease at inception of the arrangement based on whether it has the right to obtain substantially all of the economic benefits from the use of an identified asset and whether it has the right to direct the use of an identified asset in exchange for consideration, which relates to an asset which the Company does not own. Right of use (“ROU”) assets represent the Company’s right to use an underlying asset for the lease term and lease liabilities represent the Company’s obligation to make lease payments arising from the lease. ROU assets are recognized as the lease liability, adjusted for lease incentives received. Lease liabilities are recognized at the present value of the future lease payments at the lease commencement date. The interest rate used to determine the present value of the future lease payments is the Company’s incremental borrowing rate (“IBR”), because the interest rate implicit in most of the Company’s leases is not readily determinable. The IBR is a hypothetical rate based on the Company’s understanding of what its credit rating would be to borrow
| F-94 |
and resulting interest the Company would pay to borrow an amount equal to the lease payments in a similar economic environment over the lease term on a collateralized basis. Lease payments may be fixed or variable; however, only fixed payments or
in-substance
fixed payments are included in the Company’s lease liability calculation. Variable lease payments may include costs such as common area maintenance, utilities, real estate taxes or other costs. Variable lease payments are recognized in operating expenses in the period in which the obligation for those payments are incurred. Operating lease expense is recognized on a straight-line basis in operations over the lease term. The Company’s leases primarily include corporate offices and data centers. The lease term of operating leases vary from less than a year to 16 years. The Company has leases that include one or more options to extend the lease term for up to 4 periods of 5 years each, as well as options to terminate the lease no earlier than the 3rd anniversary of the commencement date. The Company’s lease terms may include options to extend or terminate the lease when it is reasonably certain that the Company will exercise such options. The Company’s lease agreements generally do not contain any residual value guarantees or restrictive covenants.
Goodwill
Goodwill represents the excess of the purchase price over the fair value of net assets acquired in a business combination. Goodwill balances generated from prior acquisitions were contributed to the Company by Uber on July 2, 2019. The Company is expected to benefit from the synergies of the business combination, including the ability to gain efficiencies with developing self-driving technology solutions.
The Company tests goodwill for impairment at least annually, in the fourth quarter, or whenever events or changes in circumstances indicate that goodwill might be impaired. In testing for goodwill impairment, the Company first assesses qualitative factors to determine whether the existence of events or circumstances leads to a determination that it is more likely than not that the fair value of a reporting unit is less than its carrying amount. If, after assessing the totality of events or circumstances, the Company determines it is not more likely than not that the fair value is less than its carrying amount, then additional impairment testing is not required. However, if the Company concludes otherwise, the Company proceeds to the quantitative assessment.
The quantitative assessment compares the estimated fair value to its book value, including goodwill. If the fair value exceeds book value, goodwill is considered not to be impaired and no additional steps are necessary. However, if the book value exceeds its fair value, an impairment loss will be recognized in an amount equal to that excess, limited to the total amount of goodwill.
The results of the Company’s annual goodwill impairment tests for the period from Inception through December 31, 2019 and the fiscal year ending December 31, 2020 indicated that no goodwill impairment existed as of the test date.
Intangible Assets, Net
Finite-lived intangible assets are carried at cost and amortized on a straight-line basis over their estimated useful lives, which range from one to eight years. The Company reviews finite-lived intangible assets for impairment under the long-lived asset model described in the Evaluation of Long-Lived Assets for Impairment section. The Company has
in-process
research and development (“IPR&D”) intangible assets used in the development of AV technology that was contributed at carry over basis and classified as indefinite-lived intangible assets. Both finite-lived and indefinite-lived intangibles assets are part of intangible assets, net on the Company’s balance sheets. There have been no impairment charges related to intangible assets recorded in the period presented in the accompanying consolidated financial statements. Refer to Note 5 - Intangible Assets for further information. Evaluation of Long-Lived Assets for Impairment
The Company evaluates its long-lived assets for indicators of possible impairment when events or changes in circumstances indicate the carrying amount of an asset or asset group (collectively, the “asset group”) may
held-and-used
| F-95 |
not be recoverable. The Company measures the recoverability of the asset group by comparing the carrying amount of such asset groups to the future undiscounted cash flows it expects the asset group to generate. If the Company considers the asset group to be impaired, the impairment to be recognized equals the amount by which the carrying value of the asset group exceeds its fair value.
The Company performs a qualitative assessment on the indefinite-lived intangible assets in the fourth quarter of each year, or more frequently if indicators of potential impairment exist. An impairment loss is recognized when the carrying value of an indefinite-lived intangible asset exceeds its fair value. Based on the qualitative assessment, there have been no events or changes in circumstances which indicate the Company’s indefinite-lived intangible assets are impaired as of December 31, 2019 and 2020.
held-and-used
Collaboration Revenue
The Company entered into a three-year joint collaboration agreement (the “Collaboration Agreement”) among the Company, Toyota Motor North America, Inc. (“Toyota”), and DENSO International America, Inc. (“DENSO”) to develop next-generation self-driving hardware and self-driving vehicles leveraging technology and expertise from each of the parties. The Collaboration Agreement became effective on July 2, 2019. The Company will receive cash consideration over the three-year term in six semi-annual increments of $50.0 million for a total $300.0 million over the course of the collaboration.
The Company applied ASC 808,, for recognition and presentation of the consideration received as collaboration revenue. The development activities are considered ongoing and central to the activities of the Company. As a result, the amounts received from Toyota are recognized as collaboration revenue ratably over the respective
Collaborative Arrangements
six-month
service period to which each payment relates, as the related development activities are performed. From Inception through December 31, 2019 and for the fiscal year ending December 31, 2020, we recognized $41.7 million and $100 million, respectively, as revenue under the Collaboration Agreement. We have recorded a contract liability of $8.3 million as of December 31, 2019 and 2020, which is included in accrued and other current liabilities on the consolidated balance sheets. In December 2020, Uber announced the sale of the Company to Aurora. As a result of the sale, the Collaboration Agreement was terminated. Refer to Note 11 - Subsequent Events for further information.
Expenses
Set forth below is a brief description of the components of the Company’s expenses:
Research and development expenses
350-40
and ASC 730, Research and development
General and administrative expenses
Depreciation and amortization expenses
| F-96 |
Restructuring and Related Charges
right-of-use
right-of-use
cease-use
date. Costs associated with lease contracts are accounted for under the leasing accounting guidance or under the long-lived assets accounting guidance. Restructuring and related charges are recognized as an operating expense within the consolidated statements of operations and are classified based on our classification policy for each category of operating expense. Personnel costs are classified based on each employee’s classification, lease costs (including impairments of assets) are classified in the same expense line item where each lease’s rent expense was recognized and impairment of other long-lived assets are recorded within general and administrative expenses.
right-of-use
Income Taxes
The Company is organized as a limited liability company (“LLC”) and has elected to be treated as a partnership for federal and state income tax purposes. Therefore, no provision has been made for federal and state income taxes since these taxes are the personal responsibility of the unit holders.
The Company’s wholly owned subsidiaries, Apparate Canada Inc. and Uber Apparate B.V. are taxed as corporations. Therefore, current and deferred tax expense is recorded based upon their operating results. Deferred income tax assets and liabilities are recognized at current income tax rates for the expected future income tax consequences of temporary differences between the carrying amounts and the income tax bases of assets and liabilities. Deferred income tax assets are recognized, net of any valuation allowance, for the estimated future income tax effects of deductible temporary differences and tax operating loss and credit carryforwards. Deferred income taxes are not material from Inception through December 31, 2020.
Although the Company’s income or loss is taxed directly to the unit holders, the effects of an uncertain tax position, if any, may have an impact on the tax return of the unit holder. Therefore, GAAP requires that any such effects be recognized based on the outcome that is more likely than not to occur. Under this criterion the most likely resolution of the uncertain tax position should be analyzed based on technical merits and on the outcome that will likely be sustained under examination. The Company, pursuant to its operating agreement with its members, will elect to pass any audit adjustments to its members who will report the adjustments under the applicable procedural guidance issued by the IRS. Any uncertain tax positions with regard to the Company’s wholly-owned subsidiaries will be reported in the financial statements. The Company has determined that it has no uncertain tax positions that require either recognition or disclosure in the financial.
The Company’s income tax returns for 2019 and 2020 are subject to examination by the taxing authorities.
| F-97 |
Recently Adopted Accounting Pronouncements
In June 2016, the FASB issued ASU debt securities and purchased financial assets with credit deterioration. ASC 326 was subsequently amended by ASU
2016-13,
“Financial Instruments - Credit Losses (Topic 326): Measurement of Credit Losses on Financial Instruments” to require the measurement of all expected credit losses for financial assets held at the reporting date based on historical experience, current conditions, and reasonable and supportable forecasts. The standard also amends the accounting for credit losses on available-for-sale
2019-04,
“Codification Improvements to Topic 326, Financial Instruments - Credit Losses, Topic 815, Derivatives and Hedging, and Topic 825, Financial Instruments.” We adopted the standard and related amendments effective January 1, 2020 on a modified retrospective basis. The adoption of the new standard did not have a material impact on our consolidated financial statements. In August 2018, the FASB issued ASU
2018-13,
“Fair Value Measurement (Topic 820): Disclosure Framework - Changes to the Disclosure Requirements for Fair Value Measurement,” which modifies the disclosure requirements in ASC 820, “Fair Value Measurement” (“ASC 820”). We adopted the new standard effective January 1, 2020 on a prospective basis. The adoption of the new standard did not have a material impact on our consolidated financial statements. In August 2018, the FASB issued ASU We adopted the new standard effective January 1, 2020 on a prospective basis. The adoption of the new standard did not have a material impact on our consolidated financial statements.
2018-15,
“Intangibles-Goodwill and Other-Internal-Use
Software (Subtopic 350-40):
Customer’s Accounting for Implementation Costs Incurred in a Cloud Computing Arrangement That Is a Service Contract,” which aligns the requirements for capitalizing implementation costs incurred in a cloud computing arrangement that is a service contract with the requirements for capitalizing implementation costs incurred to develop or obtain internal-use-software.
In December 2019, the FASB issued ASU
2019-12,
“Income Taxes (Topic 740): “Simplifying the Accounting for Income Taxes,” which removes certain exceptions for performing intraperiod allocation, recognizing deferred taxes for investments, and calculating income taxes in interim periods. The guidance reduces complexity in certain areas, including franchise taxes that are partially based on income and accounting for tax law changes in interim periods. We early adopted the new standard effective January 1, 2020 on a prospective basis. The adoption of the new standard did not have a material impact on our consolidated financial statements. Recently Issued Accounting Pronouncements Not Yet Adopted
In January 2020, the FASB issued ASU
2020-01,
“Investments-Equity Securities (Topic 321), Investments—Equity Method and Joint Ventures (Topic 323), and Derivatives and Hedging (Topic 815): Clarifying the Interactions between Topic 321, Topic 323, and Topic 815,” which clarifies the interaction of the accounting for equity investments under Topic 321 and investments accounted for under the equity method of accounting in Topic 323 and the accounting for certain forward contracts and purchased options accounted for under Topic 815. The standard is effective for public companies for fiscal years, and interim periods within those fiscal years, beginning after December 15, 2020. Early adoption is permitted. This accounting standard update will not have a material impact on our consolidated financial statements. | F-98 |
Note 3 - Property and Equipment, Net
The components of property and equipment, net as of December 31, 2019 and December 31, 2020 were as follows:
As of December 31, |
As of December 31, |
|||||||
(in thousands) |
2019 |
2020 |
||||||
| Land |
$ | 9,986 | $ | 9,986 | ||||
| Building and site improvements |
37,810 | 37,810 | ||||||
| Leasehold improvements |
79,954 | 66,947 | ||||||
| Computer equipment |
161,723 | 179,546 | ||||||
| Furniture and fixtures |
5,388 | 4,908 | ||||||
| Construction in progress |
13,813 | 309 | ||||||
| |
|
|
|
|||||
| Total |
308,674 | 299,506 | ||||||
| Less: Accumulated depreciation and amortization |
(201,175 | ) | (214,302 | ) | ||||
| |
|
|
|
|||||
| Property and equipment, net |
$ | 107,499 | $ | 85,204 | ||||
| |
|
|
|
|||||
Depreciation expense relating to property and equipment was $27.9 million and $18.9 million for the period from Inception through December 31, 2019 and for the fiscal year ending December 31, 2020, respectively.
In response to the
COVID-19
pandemic, the Company performed certain restructuring activities during the second quarter of 2020. As part of the restructuring, the Company incurred a $23.5 million property and equipment impairment loss related to the abandonment decision of the Pier 70 office space in San Francisco for the fiscal year ending December 31, 2020. Note 4 - Leases
Our leases primarily include corporate offices, data centers and servers.
In the second quarter of 2020, we exited the Pier 70 leased offices, primarily due to the City of San Francisco’s extended orders and our restructuring activities, resulting in an impairment loss of $23.9 million with no change in the remaining operating lease liability.
shelter-in-place
In the fourth quarter of 2020, the remaining operating right-of-use asset and lease liability associated with the Pier 70 leased offices were assigned and transferred to the Uber parent entity, which resulted in a $24.0 million capital contribution from Neben in members’ equity for the fiscal year ending December 31, 2020.
The components of lease expense were as follows:
(in thousands) |
For the Period from April 8, 2019 (Inception) Through December 31, 2019 |
Year Ended December 31, 2020 |
||||||
| Operating lease cost |
$ | 8,456 | $ | 14,348 | ||||
| Short-term lease cost |
45 | — | ||||||
| Variable lease cost |
2,466 | 8,477 | ||||||
| Sublease income |
(52 | ) | (781 | ) | ||||
| |
|
|
|
|||||
| Total lease cost |
$ | 10,915 | $ | 22,044 | ||||
| |
|
|
|
|||||
| F-99 |
Supplemental cash flow information related to leases was as follows:
(in thousands) |
For the Period from April 8, 2019 (Inception) Through December 31, 2019 |
Year Ended December 31, 2020 |
||||||
| Cash paid for amounts included in the measurement of lease liabilities: |
||||||||
| Operating cash flows from operating leases |
$ | 6,850 | $ | 16,295 | ||||
| Right-of-use |
||||||||
| Operating lease liabilities |
$ | 1,839 | $ | 9,270 | ||||
Supplemental balance sheet information related to leases was as follows:
As of December 31, |
As of December 31, |
|||||||
2019 |
2020 |
|||||||
| Weighted-average remaining lease term |
||||||||
| Operating leases |
8 years | 6 years | ||||||
| Weighted-average discount rate |
||||||||
| Operating leases |
8.2 | % | 4.5 | % | ||||
Maturities of operating lease liabilities were as follows
:
As of December 31, |
||||
(in thousands) |
2020 |
|||
| 2021 |
$ | 6,823 | ||
| 2022 |
6,709 | |||
| 2023 |
5,039 | |||
| 2024 |
5,003 | |||
| 2025 |
3,472 | |||
| Thereafter |
10,362 | |||
| |
|
|||
| Total undiscounted lease payments |
37,408 | |||
| |
|
|||
| Less: imputed interest |
(8,854 | ) | ||
| |
|
|||
| Total operating lease liabilities |
$ | 28,554 | ||
| |
|
|||
| F-100 |
Note 5 - Intangible Assets
The components of intangible assets, net as of December 31, 2019 and 2020 were as follows:
(in thousands, except years) |
Gross Carrying Value |
Accumulated Amortization |
Net Carrying Value |
Weighted Average Remaining Useful Life - Years |
||||||||||||
| December 31, 2019 |
||||||||||||||||
| Developed technology (1)
|
$ | 37,930 | $ | (6,396) | $ | 31,534 | 1 year | |||||||||
| Patents |
806 | (228 | ) | 578 | 8 years | |||||||||||
| |
|
|
|
|
|
|||||||||||
| Intangible Assets |
$ | 38,736 | $ | (6,624) | $ | 32,112 | ||||||||||
| |
|
|
|
|
|
|||||||||||
(in thousands, except years) |
Gross Carrying Value |
Accumulated Amortization |
Net Carrying Value |
Weighted Average Remaining Useful Life - Years |
||||||||||||
| December 31, 2020 |
||||||||||||||||
| Developed technology |
$ | 37,930 | $ | (7,380) | $ | 30,550 | ||||||||||
| Patents |
806 | (310 | ) | 496 | 7 years | |||||||||||
| |
|
|
|
|
|
|||||||||||
| Intangible Assets |
$ | 38,736 | $ | (7,690) | $ | 31,046 | ||||||||||
| |
|
|
|
|
|
|||||||||||
|
(1) |
Developed technology intangible assets include IPR&D, which is not subject to amortization, of $30.5 million as of December 31, 2019 and 2020. |
Amortization expense for intangible assets subject to amortization was $0.8 million from inception through December 31, 2019 and $1.1 million for the fiscal year ending December 31, 2020.
The estimated aggregate future amortization expense for intangible assets subject to amortization as of December 31, 2020 is summarized below:
(in thousands) |
Estimated Future Amortization Expense |
|||
| Year Ending December 31, |
||||
| 2021 |
$ | (82) | ||
| 2022 |
(77 | ) | ||
| 2023 |
(77 | ) | ||
| 2024 |
(62 | ) | ||
| 2025 |
(41 | ) | ||
| Thereafter |
(149 | ) | ||
| |
|
|||
| Total |
$ | (488) | ||
| |
|
|||
| F-101 |
Note 6 - Accrued and Other Current Liabilities
Accrued and other current liabilities as of December 31, 2019 and 2020, consist of the following:
As of December 31, |
As of December 31, |
|||||||
(in thousands) |
2019 |
2020 |
||||||
| Accrued compensation and employee benefits |
$ | 28,645 | $ | 24,056 | ||||
| Accrued research and development |
12,423 | 30,229 | ||||||
| Accrued travel and expense |
5,155 | 51 | ||||||
| Accrued professional and contractor services |
3,087 | 1,786 | ||||||
| Accrued marketing |
2,277 | — | ||||||
| Other accrued expenses |
4,206 | 3,220 | ||||||
| Short-term deferred revenue |
8,333 | 8,333 | ||||||
| |
|
|
|
|||||
| Accrued and other current liabilities |
$ | 64,126 | $ | 67,675 | ||||
| |
|
|
|
|||||
Note 7 - Members’ Equity
Common Units
From Inception through December 31, 2020, Neben is the only holder of Common Units of the Company. Holders of common units are entitled to dividends when and if declared by the Board of Members, subject to the rights of the holders of all classes of units outstanding having priority rights to dividends. As of December 31, 2019 and 2020, no dividends have been declared for common shareholders. As of December 31, 2019 and 2020, there were 6,267,953 and 6,458,885 shares of common units issued and outstanding which represents 86.2% and 86.6% ownership of the Company, respectively.
The consolidated financial statements include certain assets and liabilities that have historically been held at Uber, which were contributed on July 2, 2019 to the Company at carry over basis. The following table summarizes the assets and liabilities contributed as of July 2, 2019:
(in thousands) |
As of July 2, 2019 |
|||
| Cash |
$ | 946 | ||
| Current assets |
12,825 | |||
| Property and equipment, net |
107,268 | |||
| Operating lease right-of-use |
74,888 | |||
| Other long-term assets |
63,294 | |||
| |
|
|||
| Total assets |
$ | 259,221 | ||
| |
|
|||
| Current liabilities |
33,420 | |||
| Non-current liabilities |
63,775 | |||
| |
|
|||
| Total liabilities |
$ | 97,195 | ||
| |
|
|||
Convertible Class A Preferred Units
On July 2, 2019 (“the Close Date”), the Company amended its Limited Liability Agreement and entered into a Preferred Unit Purchase Agreement with SVF Yellow USA Corporation (“SoftBank”), Toyota, and DENSO (collectively “the Investors”) for the purchase by the Investors of Convertible Class A Preferred Units (“Preferred Units”) in the Company. On the Close Date, the Company issued 1.0 million Preferred Units at $1,000 per unit to the Investors for aggregate consideration of $1.0 billion ($400.0 million from Toyota, $333.0 million from SoftBank, and $267.0 million from DENSO).
| F-102 |
Voting
Preferred units do not have general voting rights.
Conversion Rights
At the option of the Investors, Preferred Units are convertible into common units of the Company at any time, initially on a basis but subject to potential adjustment, as defined by the Preferred Unit Purchase Agreement. As of December 31, 2019 and 2020, the Preferred Units represent an aggregate 13.8% and 13.4% ownership interest in the Company based on issued and outstanding units of ownership on an
one-for-one
as-converted
basis, respectively. Dividends and distributions
The Preferred Units are entitled to certain distributions, including, primarily dividends, which are payable in cash or on Preferred Units, respectively.
in-kind
(at the Company’s discretion). Dividends accrue quarterly compounded on the last day of each quarter at a 4.5% annual rate. From Inception through December 31, 2019 and for the fiscal year ending December 31, 2020, $25.7 million and $53.4 million of dividends were paid-in-kind
Liquidation Preference
The Preferred Units are entitled to distributions upon the occurrence of a sale or liquidation of the Company representing an amount that is equal to the greater of (i) the original investment plus any accrued but unpaid amounts, and (ii) their share of distributions assuming conversion to common units of the Company immediately prior to the sale or liquidation event. The quarterly dividend, along with any attributed prorated share of the Company’s net income (if applicable), are included as an adjustment to the Preferred Units in the Company’s members’ equity. The Preferred Units do not participate in net losses due to a liquidation preference.
SoftBank’s Put Right and Uber’s Call Right
Beginning on July 2, 2026, SoftBank has the option to sell to Uber all, but not less than all, of SoftBank’s Preferred Units (“SoftBank’s Preferred Units”) at a price equal to the number of SoftBank’s Preferred Units multiplied by the greater of (i) the original investment plus any accrued but unpaid amounts per unit and (ii) the fair value of the Preferred Units at the time of exercise (the “Put/Call Price”). Beginning on July 2, 2026, Uber can call all, but not less than all, of SoftBank’s Preferred Units at the Put/Call Price. Uber has the option to settle all or a portion of the Put/Call Price with Uber’s common stock and any remainder will be satisfied with Uber’s cash. The put and call were determined to be embedded features within the SoftBank Preferred Units since they are not separately exercisable or legally detachable from the SoftBank Preferred Units.
Uber Parent Stock Plan Details of Grants to Apparate Employees
Uber grants stock-based awards as compensation to Apparate employees under the Uber Parent stock plan. Uber administers the plan and the Company reimburses Uber under a Support Services Agreement as described in Note 8 - Related Party Transactions.
| F-103 |
RSU Activity
The following table summarizes the activity related to Uber’s restricted stock units (“RSUs”) granted to the Company’s employees from inception of the Uber parent stock plan through December 31, 2020. For purposes of this table, vested RSUs represent the shares for which the service condition had been fulfilled as of December 31, 2019 and 2020 (in thousands, except per share amounts):
Number of Shares |
Weighted-Average Grant-Date Fair Value per Share |
|||||||
| Unvested and outstanding as of July 2, 2019 |
9,712 | $ | 42.97 | |||||
| Granted |
2,976 | $ | 36.51 | |||||
| Vested |
(2,011 | ) | $ | 38.57 | ||||
| Canceled and forfeited |
(731 | ) | $ | 40.92 | ||||
| |
|
|||||||
| Unvested and outstanding as of December 31, 2019 |
9,946 | $ | 39.59 | |||||
| |
|
|||||||
| Granted |
7,080 | $ | 26.76 | |||||
| Vested |
(4,979 | ) | $ | 35.89 | ||||
| Canceled and forfeited |
(2,618 | ) | $ | 35.41 | ||||
| |
|
|||||||
| Unvested and outstanding as of December 31, 2020 |
9,429 | $ | 34.41 | |||||
| |
|
|||||||
The total fair value of RSUs vested from Contribution through December 31, 2019 and for the fiscal year ending December 31, 2020 was $77.6 million and $178.7 million, respectively.
Stock-Based Compensation Expense on RSUs
Stock-based compensation expense is allocated based on the cost center to which the award holder belongs. The following table summarizes total stock-based compensation expense by function from inception through December 31, 2019 and for the fiscal year ending December 31, 2020:
(in thousands) |
For the Period from April 8, 2019 (Inception) Through December 31, 2019 |
Year Ended December 31, 2020 |
||||||
| Research and development |
$ | 77,187 | $ | 103,452 | ||||
| General and administrative |
10,825 | 9,952 | ||||||
| |
|
|
|
|||||
| Total |
$ | 88,012 | $ | 113,404 | ||||
| |
|
|
|
|||||
As of December 31, 2020, there was $246.1 million of unamortized compensation costs related to all unvested awards. The unamortized compensation costs are expected to be recognized over a weighted-average period of approximately 2.75 years. The tax benefits recognized in the consolidated statements of operations for stock-based compensation arrangements were not material from inception through December 31, 2019 and for the fiscal year ending December 31, 2020 .
Stock-Based Compensation Expense on Incentive Stock Options and
Non-Qualified
Stock Options The Uber parent stock plan provides for the grant of stock options, including incentive stock options and
non-qualified
stock options to purchase Uber parent common stock. Certain awards include performance based | F-104 |
vesting criteria. The total grant date fair value of outstanding stock options with performance based vesting criteria issued to employees of the Company is approximately $3.3 million, or $16.72 per award. Performance based awards are granted at the money, and the fair value of performance based awards was determined at the grant date using the Black-Scholes option pricing model. Key inputs to the Black-Scholes option pricing model include: a term of 7 years, volatility of 33.8%, a risk free rate of 2.85%, a dividend rate of 0.0%, and a common stock price of $40.60. The performance condition is not probable as of Contribution or December 31, 2020, and therefore no compensation has been recorded to date.
The performance conditions were waived and the awards will vest upon the close of the sale to Aurora. The outstanding stock options were revalued at the sale closing date. The fair value is approximately $4.7 million, or $23.25 per award.
Aside from these performance based awards, no other incentive stock options or
non-qualified
stock options issued under the Uber parent stock plan to employees of the Company have remaining unrecorded stock-based compensation as of Contribution or December 31, 2020. Note 8 - Related Party Transactions
Collaboration Agreement with Toyota and DENSO
In conjunction with the Preferred Unit Purchase Agreement discussed above, the Company entered into the Collaboration Agreement with Toyota and DENSO to develop next-generation self-driving technology. Pursuant to the Collaboration Agreement, Toyota will make cash payments to the Company up to an aggregate of $300.0 million, payable in six semi-annual installments during the three-year term of the Collaboration Agreement. The Company had no outstanding receivable balance from Toyota and DENSO as of December 31, 2019 and 2020.
The Collaboration Agreement was terminated upon the sale of the Company to Aurora. Refer to Note 11 - Subsequent Events.
Support Services Agreement
On July 2, 2019, the Company entered into an arrangement with Uber, as Uber and its subsidiaries perform certain activities on behalf of the Company including administering an employee equity incentive plan, providing certain overhead and services. Related party payables are recorded for the amounts subject to reimbursement in cash to Uber or wholly-owned subsidiaries of Uber. As of December 31, 2019 and 2020, $9.9 million and $31.6 million of related party payables was recorded on the consolidated balance sheets, respectively. In addition, $85.2 million and $207.6 million of members’ equity was attributed to Neben for reimbursement to Uber of Apparate employees vesting in stock-based awards issued under Uber Parent stock plan which vested from Contribution to December 31, 2019 and for the fiscal year ending December 31, 2020, respectively. The Uber parent stock plan activity is treated as contribution of members’ equity as it will be settled in additional Common Units of the Company.
Note 9 - Contingencies
From time to time, the Company may be a party to various claims and litigation or subject to regulatory fines in the normal course of business. Legal fees and other costs associated with such actions are expensed as incurred. The Company assesses the need to record a liability for litigation and contingencies. Liabilities are recorded when and if it is determined that a loss-related matter is both probable and reasonably estimable.
As of December 31, 2020, the Company did not deem outstanding contingencies probable and reasonably estimable, and therefore has not recorded liabilities related to legal matters that were contingencies as of that date. While it is not
| F-105 |
feasible to predict or determine the final outcome of these proceedings, the Company believes that the disposition of these proceedings will not have a material effect on the Company’s financial statements.
Note 10 - Restructuring and Related Charges
During the second quarter of 2020, we initiated and completed certain restructuring activities in order to reduce our overall cost structure in response to the economic challenges and uncertainty resulting from the
COVID-19
pandemic and its impact on our business. We incurred costs related to site closures, asset impairments and write-offs. The following table presents the total restructuring and related charges by function:
(in thousands) |
Year Ended December 31, 2020 |
|||
| Research and development |
$ | 34,110 | ||
| General and administrative |
24,600 | |||
| Sales and marketing |
151 | |||
| |
|
|||
| Total |
$ | 58,861 | ||
| |
|
|||
The following table provides the components of and changes in our restructuring and related charges accrual during the year ended December 31, 2020:
(in thousands) |
Severance and Other Termination Benefits |
Site Closure Costs |
Total |
|||||||||
| Balance as of December 31, 2019 |
$ | — | $ | — | $ | — | ||||||
| Charges 1
|
11,147 | 47,714 | 58,861 | |||||||||
| Cash payments |
(10,144 | ) | — | (10,144 | ) | |||||||
| Non-cash adjustments |
— | (47,714 | ) | (47,714 | ) | |||||||
| |
|
|
|
|
|
|||||||
| Balance as of December 31, 2020 |
$ | 1,003 | $ | — | $ | 1,003 | ||||||
| |
|
|
|
|
|
|||||||
Note 11 - Subsequent Events
Sale to Aurora
On December 7, 2020, Uber announced the sale of the Company to Aurora. On January 19, 2021, the sale to Aurora was completed. As a result of the sale, Uber holds equity interests in Aurora and the Collaboration Agreement with Toyota and DENSO was terminated.
As part of the sale transaction, Uber allowed unvested RSUs for Uber stock held by employees of Apparate that transferred to Aurora to continue to vest over the next 12 months contingent upon the employee remaining at Aurora.
The Company evaluated subsequent events through May 19, 2021, the date the consolidated financial statements were available for issuance and determined that no other subsequent events occurred that would require recognition in the consolidated financial statements or disclosure in the notes thereto.
|
1 |
Site closure costs primarily include $23.9 million related to the impairment of operating lease right-of-use |
| F-106 |
903,072,352 Shares of Class A Common Stock
8,900,000 Warrants to Purchase Shares of Class A Common A Common Stock

PROSPECTUS
, 2021
You should rely only on the information contained in this prospectus or any supplement or amendment hereto. We have not authorized anyone to provide you with different information. You should not assume that the information contained in this prospectus or any supplement or amendment hereto is accurate as of any date other than the date of this prospectus or any such supplement or amendment. Neither the Securities and Exchange Commission nor any state securities commission has approved or disapproved of these securities or determined if this prospectus is truthful or complete. Any representation to the contrary is a criminal offense.
PART II
INFORMATION NOT REQUIRED IN PROSPECTUS
Item 13. |
Other Expenses of Issuance and Distribution |
The following table sets forth all expenses to be paid by us in connection with the issuance and distribution of the shares of Class A Common Stock and Warrants being registered by this registration statement. All amounts shown are estimates except for the SEC registration fee.
We will bear all costs, expenses and fees in connection with the registration of the securities. Selling Securityholders, however, will bear all brokers and underwriting commissions and discounts, if any, attributable to their sale of the Securities.
Amount |
||||
SEC registration fee |
$ | 816,795 | ||
Accounting fees and expenses |
78,500 | |||
Legal fees and expenses |
125,000 | |||
Financial printing and miscellaneous expenses |
120,000 | |||
Total |
$ | 1,140,295 | ||
Item 14. |
Indemnification of Directors and Officers |
Section 102(b)(7) of the Delaware General Corporation Law (DGCL) allows a corporation to provide in its certificate of incorporation that a director of the corporation will not be personally liable to the corporation or its stockholders for monetary damages for breach of fiduciary duty as a director, except where the director breached the duty of loyalty, failed to act in good faith, engaged in intentional misconduct or knowingly violated a law, authorized the payment of a dividend or approved a stock repurchase in violation of Delaware corporate law or obtained an improper personal benefit. Our amended and restated certificate of incorporation provides for this limitation of liability.
Section 145 of the DGCL, provides, among other things, that a Delaware corporation may indemnify any person who was, is or is threatened to be made, party to any threatened, pending or completed action, suit or proceeding, whether civil, criminal, administrative or investigative (other than an action by or in the right of such corporation), by reason of the fact that such person is or was an officer, director, employee or agent of such corporation or is or was serving at the request of such corporation as a director, officer, employee or agent of another corporation or enterprise. The indemnity may include expenses (including attorneys’ fees), judgments, fines and amounts paid in settlement actually and reasonably incurred by such person in connection with such action, suit or proceeding, provided such person acted in good faith and in a manner he or she reasonably believed to be in or not opposed to the corporation’s best interests and, with respect to any criminal action or proceeding, had no reasonable cause to believe that his or her conduct was unlawful. A Delaware corporation may indemnify any persons who were or are a party to any threatened, pending or completed action or suit by or in the right of the corporation by reason of the fact that such person is or was a director, officer, employee or agent of another corporation or enterprise. The indemnity may include expenses (including attorneys’ fees) actually and reasonably incurred by such person in connection with the defense or settlement of such action or suit, provided such person acted in good faith and in a manner he or she reasonably believed to be in or not opposed to the corporation’s best interests, provided further that no indemnification is permitted without judicial approval if the officer, director, employee or agent is adjudged to be liable to the corporation. Where an officer or director is successful on the merits or otherwise in the defense of any action referred to above, the corporation must indemnify him or her against the expenses (including attorneys’ fees) which such officer or director has actually and reasonably incurred.
II-1
Section 145 further authorizes a corporation to purchase and maintain insurance on behalf of any person who is or was a director, officer, employee or agent of the corporation or is or was serving at the request of the corporation as a director, officer, employee or agent of another corporation or enterprise, against any liability asserted against such person and incurred by such person in any such capacity, or arising out of his or her status as such, whether or not the corporation would otherwise have the power to indemnify such person under Section 145.
Our Bylaws provide that we must indemnify and advance expenses to our directors and officers to the full extent authorized by the DGCL.
We have entered into indemnification agreements with each of our directors and executive officers. Such agreements may require us, among other things, to advance expenses and otherwise indemnify our executive officers and directors against certain liabilities that may arise by reason of their status or service as executive officers or directors, to the fullest extent permitted by law.
The indemnification rights set forth above shall not be exclusive of any other right which an indemnified person may have or hereafter acquire under any statute, any provision of our Certificate of Incorporation, Bylaws, agreement, vote of stockholders or disinterested directors or otherwise. Notwithstanding the foregoing, we shall not be obligated to indemnify a director or officer in respect of a proceeding (or part thereof) instituted by such director or officer, unless such proceeding (or part thereof) has been authorized by the Board pursuant to the applicable procedure outlined in our Bylaws.
Section 174 of the DGCL provides, among other things, that a director, who willfully or negligently approves of an unlawful payment of dividends or an unlawful stock purchase or redemption, may be held jointly and severally liable for such actions. A director who was either absent when the unlawful actions were approved or dissented at the time may avoid liability by causing his or her dissent to such actions to be entered in the books containing the minutes of the meetings of the Board at the time such action occurred or immediately after such absent director receives notice of the unlawful acts.
We currently maintain and expect to continue to maintain standard policies of insurance that provide coverage (1) to our directors and officers against loss rising from claims made by reason of breach of duty or other wrongful act and (2) to us with respect to indemnification payments that we may make to such directors and officers.
These provisions may discourage stockholders from bringing a lawsuit against our directors for breach of their fiduciary duty. These provisions also may have the effect of reducing the likelihood of derivative litigation against directors and officers, even though such an action, if successful, might otherwise benefit us and our stockholders. Furthermore, a stockholder’s investment may be adversely affected to the extent we pay the costs of settlement and damage awards against officers and directors pursuant to these indemnification provisions.
We believe that these provisions, the insurance, and the indemnity agreements are necessary to attract and retain talented and experienced officers and directors.
Item 15. |
Recent Sales of Unregistered Securities |
Since November 3, 2018, Aurora Innovation, Inc.. (f/k/a Reinvent Technology Partners Y) has issued the following unregistered securities:
On March 18, 2021, the RTPY consummated its initial public offering of 97,750,000 units (the “Units”), including the issuance of 12,750,000 Units as a result of the underwriter’s exercise of its over-allotment option. Each Unit consists of one Class A ordinary share of the Company, par value $0.00001 per share (an “Ordinary Share”), and
one-eighth
of one redeemable warrant of the Company. Each whole warrant entitled the holder thereof to purchase one Ordinary Share for $11.50 per share, subject to adjustment. The Units were sold at a price of $10.00 per Unit, generating gross proceeds to the Company of $977,500,000. II-2
On December 11, 2020, in connection with the closing of the RTPY IPO, RTPY consummated a private placement of an aggregate 8,900,000 Private Placement Warrants at a price of $2.50 per Private Placement Warrant, generating total proceeds of approximately $22,250,000. The Private Placement Warrants are identical to the warrants sold as part of the Units in the RTPY IPO except that, so long as they are held by the Sponsor or its permitted transferees: (1) they will not be redeemable by the Company (except in certain redemption scenarios when the price per Ordinary Share equals or exceeds $10.00 (as adjusted)); (2) they (including the Ordinary Shares issuable upon exercise of these warrants) may not, subject to certain limited exceptions, be transferred, assigned or sold by the Sponsor until 30 days after the completion of the Company’s initial business combination; (3) they may be exercised by the holders on a cashless basis; and (4) they (including the Ordinary Shares issuable upon exercise of these warrants) are entitled to registration rights.
In connection with the consummation of the Merger, on November 3, 2021, a number of accredited investor purchasers purchased from the Company an aggregate of 100,000,000 shares of Class A Common Stock, for a purchase price of $10.00 per share and an aggregate purchase price of $1.0 billion, pursuant to separate subscription agreements entered into effective as of July 14, 2021. Pursuant to the PIPE Subscription Agreements, the Company gave certain registration rights to the PIPE Investors with respect to the PIPE Shares.
We believe the offers, sales and issuances of the above securities were exempt from registration under the Securities Act (or Regulation D or Regulation S promulgated thereunder) by virtue of Section 4(a)(2) of the Securities Act because the issuance of securities to the recipients did not involve a public offering. The recipients of the securities in each of these transactions represented their intentions to acquire the securities for investment only and not with a view to or for sale in connection with any distribution thereof, and appropriate legends were placed upon the stock certificates issued in these transactions. All recipients had adequate access, through their relationships with us, to information about us. The sales of these securities were made without any general solicitation or advertising.
Item 16. |
Exhibits and Financial Statement Schedules |
(a) Exhibits
Incorporated by reference |
Filed or Furnished Herewith |
|||||||||||
Exhibit No. |
Description |
Form |
File No. |
Exhibit No. |
Filing Date |
|||||||
| 2.1 † | Agreement and Plan of Merger, dated as of July 14, 2021, by and among Reinvent Technology Partners Y, RTPY Merger Sub Inc., and Aurora Innovation, Inc. | 8-K |
001-40216 |
2.1 | July 15, 2021 | |||||||
| 2.2† | Plan of Domestication, dated as of September 28, 2021 | S-4/A |
333-257912 |
2.2 | September 29, 2021 |
|||||||
| 2.3† | Stock Purchase and Agreement and Plan of Merger, dated as of January 19, 2021, by and between Aurora Innovation, Inc., Avian U Merger Holdco Corp., Avian U Merger Sub Corp., Avian U Merger Sub LLC, Blocker U Merger Sub LLC, SVF Yellow (USA) Corporation, Apparate USA LLC and Uber Technologies, Inc. | S-4/A |
333-257912 |
2.3 | September 29, 2021 |
|||||||
| 3.1 | Amended and Restated Certificate of Incorporation of the Company | S-4 |
333-257912 |
3.2 | July 15, 2021 | |||||||
| 3.2 | Amended and Restated Bylaws of the Company | S-4 |
333-257912 |
3.3 | July 15, 2021 | |||||||
II-3
II-4
Incorporated by reference |
Filed or Furnished Herewith |
|||||||||||||||||
Exhibit No. |
Description |
Form |
File No. |
Exhibit No. |
Filing Date |
|||||||||||||
| 10.14# | Aurora Innovation, Inc. form of Indemnification Agreement | 8-K |
001-39774 |
10.19 | |
September 29, 2021 |
|
|||||||||||
| 16.1 | Letter from WithumSmith+Brown, PC as to the change in certifying accountant, dated as of November 4, 2021 | 8-K |
001-40216 | 16.1 | |
November 4, 2021 |
|
|||||||||||
| 21.1 | List of Subsidiaries | X | ||||||||||||||||
| 23.1 | Consent of KPMG LLP, independent registered public accounting firm of Aurora Innovation, Inc. | X | ||||||||||||||||
| 23.2 | Consent of WithumSmith+Brown, P.C., independent registered public accounting firm of Reinvent Technology Partners Y | X | ||||||||||||||||
| 23.3 | Consent of PricewaterhouseCoopers LLP | X | ||||||||||||||||
| 23.4 | Consent of Wilson Sonsini Goodrich & Rosati, P.C. (included in Exhibit 5.1 hereto) | X | ||||||||||||||||
| 24.1 | Power of Attorney (included in the signature page to this Registration Statement on Form S-1) | X | ||||||||||||||||
| 101.INS | Inline XBRL Instance Document | X | ||||||||||||||||
| 101.SCH | Inline XBRL Taxonomy Extension Schema Document | X | ||||||||||||||||
| 101.CAL | Inline XBRL Taxonomy Extension Calculation Linkbase Document | X | ||||||||||||||||
| 101.DEF | Inline XBRL Taxonomy Extension Definition Linkbase Document | X | ||||||||||||||||
| 101.LAB | Inline XBRL Taxonomy Extension Label Linkbase Document | X | ||||||||||||||||
| 101.PRE | Inline XBRL Taxonomy Extension Presentation Linkbase Document | X | ||||||||||||||||
| 104 | Cover Page Interactive Data File (formatted as Inline XBRL and contained in Exhibit 101) | X | ||||||||||||||||
| † | Schedules and exhibits to this agreement have been omitted pursuant to Item 601(b)(2) of Regulation S-K. A copy of any omitted schedule and/or exhibit will be furnished to the SEC upon request. |
| # | Indicates management contract or compensatory plan or arrangement. |
(b) Financial Statement Schedules
All financial statement schedules are omitted because the information called for is not required or is shown either in the consolidated financial statements or in the accompanying notes. The financial statements filed as part of this registration statement are listed in the index to the financial statements immediately preceding such financial statements, which index to the financial statements is incorporated herein by reference.
Item 17. |
Undertakings |
Insofar as indemnification for liabilities arising under the Securities Act of 1933 may be permitted to directors, officers and controlling persons of the registrant pursuant to the foregoing provisions, or otherwise, the
II-5
registrant has been advised that in the opinion of the SEC such indemnification is against public policy as expressed in the Securities Act and is, therefore, unenforceable. In the event that a claim for indemnification against such liabilities (other than the payment by the registrant of expenses incurred or paid by a director, officer or controlling person of the registrant in the successful defense of any action, suit or proceeding) is asserted by such director, officer or controlling person in connection with the securities being registered, the registrant will, unless in the opinion of its counsel the matter has been settled by controlling precedent, submit to a court of appropriate jurisdiction the question whether such indemnification by it is against public policy as expressed in the Securities Act and will be governed by the final adjudication of such issue.
The undersigned registrant hereby undertakes:
1) To file, during any period in which offers or sales are being made, a post-effective amendment to this registration statement:
a. To include any prospectus required by Section 10(a)(3) of the Securities Act of 1933, as amended;
b. To reflect in the prospectus any facts or events arising after the effective date of the registration statement (or the most recent post-effective amendment thereof) which, individually or in the aggregate, represent a fundamental change in the information set forth in the registration statement. Notwithstanding the foregoing, any increase or decrease in volume of securities offered (if the total dollar value of securities offered would not exceed that which was registered) and any deviation from the low or high end of the estimated maximum offering range may be reflected in the form of prospectus filed with the SEC pursuant to Rule 424(b) if, in the aggregate, the changes in volume and price represent no more than a 20% change in the maximum aggregate offering price set forth in the “Calculation of Registration Fee” table in the effective registration statement; and
c. To include any material information with respect to the plan of distribution not previously disclosed in the registration statement or any material change to such information in the registration statement.
provided, however
2) That, for the purpose of determining any liability under the Securities Act of 1933, each such
post-effective
amendment shall be deemed to be a new registration statement relating to the securities offered therein, and the offering of such securities at that time shall be deemed to be the initial bona fide offering thereof. 3) To remove from registration by means of a post-effective amendment any of the securities being registered which remain unsold at the termination of the offering.
4) That, for the purpose of determining liability under the Securities Act of 1933 to any purchaser, each prospectus filed pursuant to Rule 424(b) as part of a registration statement relating to an offering, other than registration statements relying on Rule 430B or other than prospectuses filed in reliance on Rule 430A, shall be deemed to be part of and included in the registration statement as of the date it is first used after effectiveness. , that no statement made in a registration statement or prospectus that is part of the registration statement or made in a document incorporated or deemed incorporated by reference into the registration statement or prospectus that is part of the registration statement will, as to a purchaser with a time of contract of sale prior to such first use, supersede or modify any statement that was made in the registration statement or prospectus that was part of the registration statement or made in any such document immediately prior to such date of first use.
Provided, however
5) That, for the purpose of determining liability of the registrant under the Securities Act of 1933 to any purchaser in the initial distribution of the securities, the undersigned registrant undertakes that in a primary
II-6
offering of securities of the undersigned registrant pursuant to this registration statement, regardless of the underwriting method used to sell the securities to the purchaser, if the securities are offered or sold to such purchaser by means of any of the following communications, the undersigned registrant will be a seller to the purchaser and will be considered to offer or sell such securities to such purchaser:
a. Any preliminary prospectus or prospectus of the undersigned registrant relating to the offering required to be filed pursuant to Rule 424;
b. Any free writing prospectus relating to the offering prepared by or on behalf of the undersigned registrant or used or referred to by the undersigned registrant;
c. The portion of any other free writing prospectus relating to the offering containing material information about the undersigned registrant or its securities provided by or on behalf of the undersigned registrant; and
d. Any other communication that is an offer in the offering made by the undersigned registrant to the purchaser.
II-7
SIGNATURES
Pursuant to the requirements of the Securities Act of 1933, the registrant has duly caused this registration statement to be signed on its behalf by the undersigned, thereunto duly authorized in the City of Pittsburgh, Commonwealth of Pennsylvania, on November 5, 2021.
AURORA INNOVATION, INC. |
||
| By: | /s/ Chris Urmson |
|
Chris Urmson |
||
Chief Executive Officer |
||
POWER OF ATTORNEY
KNOW ALL PERSONS BY THESE PRESENTS, that each person whose signature appears below constitutes and appoints Chris Urmson, Richard Tame and William Mouat and each one of them, as his or her true and lawful and agents, with full power of substitution and resubstitution, for them and in their name, place and stead, in any and all capacities, to sign any and all amendments (including post-effective amendments) to this registration statement, and to sign any new registration statement with respect to the offering contemplated thereby filed pursuant to Rule 462(b) under the Securities Act of 1933, as amended, and all and agents, and each of them, full power and authority to do and perform each and every act and thing requisite and necessary to be done in connection therewith, as fully to all intents and purposes as they might or could do in person, hereby ratifying and confirming all that said and agents or any of them, or their substitute or substitutes, may lawfully do or cause to be done by virtue hereof.
attorneys-in-fact
post-effective
amendments thereto, and to file the same, with all exhibits thereto and other documents in connection therewith, with the Securities and Exchange Commission, granting unto said attorneys-in-fact
attorneys-in-fact
Pursuant to the requirements of the Securities Act of 1933, this registration statement has been signed by the following persons in the capacities and on the dates indicated.
Signature |
Title |
Date |
||
|
/s/ Chris Urmson Chris Urmson |
Chief Executive Officer and Director (Principal Executive Officer) |
November 5, 2021 | ||
|
/s/ Richard Tame Richard Tame |
Vice President, Finance (Principal Financial and Accounting Officer) |
November 5, 2021 | ||
|
/s/ Sterling Anderson Sterling Anderson |
Director | November 5, 2021 | ||
|
/s/ James Andrew Bagnell James Andrew Bagnell |
Director | November 5, 2021 | ||
|
/s/ Michelangelo Volpi Michelangelo Volpi |
Director | November 5, 2021 | ||
|
/s/ Dara Khosrowshahi Dara Khosrowshahi |
Director | November 5, 2021 | ||
II-8
Signature |
Title |
Date |
||
|
/s/ Carl Eschenbach Carl Eschenbach |
Director | November 5, 2021 | ||
|
/s/ Brittany Bagley Brittany Bagley |
Director | November 5, 2021 | ||
|
/s/ Reid Hoffman Reid Hoffman |
Director | November 5, 2021 | ||
II-9